The analysis uses only Brockovich’s own published files: her community reports, her list of facilities, and her zip-code coordinates, as archived on October 10, 2026 [1][2][3].
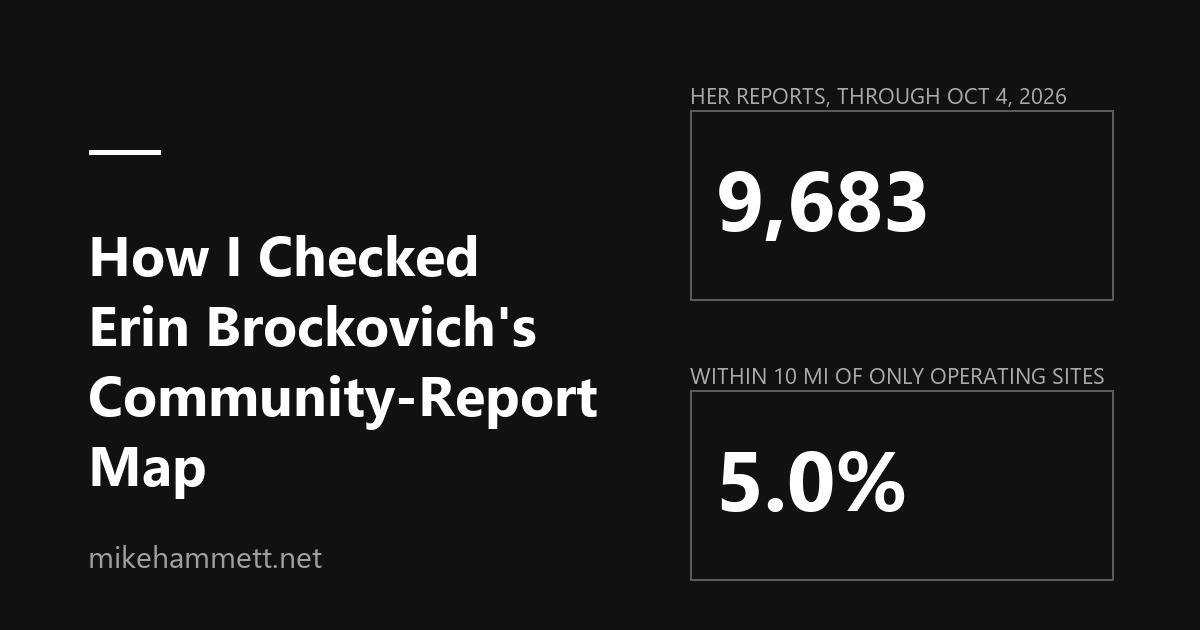
482 of her 9,683 reports through October 4, 2026, 5.0%, carry a zip code within 10 miles of at least one operating facility on her list and no listed project that isn’t operating. If cancelled projects don’t count, the figure is 510, 5.3%. A wider count, 1,084 reports or 11.2%, sits within 10 miles of an operating facility regardless of what else is nearby.
Across every radius from 1 to 30 miles, that share stays between 1.2% and 5.4%; below about 3 miles, the zip-code points are too coarse to mean much.
Averaged by status, operating campuses have 14.2 reports within 10 miles, proposed projects 14.3, and campuses under construction 17.9. Medians are 11, 8, and 13.
The code below reruns every figure against the archived files.
The inputs
Her map page loads three files from her site: community-reports.json, data-centers-map.json, and zip-geocodes.json. I confirmed that from the page’s own network requests on October 29, 2026.
The community reports file holds one record per report, with six fields: date, city and state, zip code, type, owner, and notes [1]. The archived copy holds 9,683 records, dated June 23, 2024 through October 4, 2026, and every date is in year-month-day form. The type field names the kind of facility, not the complaint: 9,661 records say data center, 18 say battery storage, and 4 are blank. Her stats page for that date shows the same total, 9,683, with data through October 4, 2026 [5].
The facility file lists 545 projects, each with a status and coordinates [2]. Its header says it was updated September 27, 2026, gives the counts by status (139 operational, 166 under construction, 39 permitted, 175 proposed, 26 cancelled), and names Compute Atlas and Epoch AI as its sources [2]. Her home page describes the list’s scope: the pins cover “publicly announced, major AI-focused and hyperscale facilities,” and “many smaller or unannounced facilities are not listed” [4].
The zip-code file gives one latitude and longitude for each zip code it covers, 2,465 of them in the archived copy [3]. The file doesn’t document how its maker chose each point, so I call it the zip code’s coordinate rather than its center.
The live reports file keeps growing. On October 29, 2026, it held 9,733 records, and requests with the version tag in the address, with a different tag, and with none all returned the same file. Filtering the live file to records dated on or before October 4 still returned 9,683, and rerunning the analysis on the live files that day gave the same 1,084 and 482. That match isn’t guaranteed later: a record can be deleted or edited, and the facility file’s statuses will change as projects open. The archived copies are the versions I analyzed, and the code below reads them.
The method sorts reports by how close their zip code sits to each facility on her list. For each report, I took its zip code’s coordinate and measured the straight-line distance to every facility, using the haversine formula with an Earth radius of 3,958.8 miles. A report counts as near a facility when that distance is 10 miles or less.
Each report goes into one bucket, the most advanced project nearby: operating first, then under construction, then permitted, proposed, or cancelled. Reports with nothing within 10 miles go into a “none” bucket. Five reports have no usable zip code: four are blank, and one, 76000, isn’t in the zip-code file.
The operating-only test then takes the reports near an operating facility and keeps those with no listed project of another status within 10 miles, cancelled projects included. A report near two operating facilities and nothing else stays in. It doesn’t depend on the bucket order: a report near an operating facility lands in the operating bucket whatever else is nearby, and the test then looks at every non-operating project on the list.
The density check counts, for each facility, every report within 10 miles of it, then gives the mean and median by status. Density counts aren’t exclusive, so one report can count toward several facilities.
Statuses come from the September 27 file, not from the date of each report. A report filed while a nearby project was still proposed counts as near an operating facility if that project had opened by September 27, so some reports in the operating group were filed before the facility ran.
The results
Bucket (10 miles)
Reports
Share
Near an operating facility
1,084
11.2%
Near a campus under construction, no operating one
2,000
20.7%
Near only proposed, permitted, or cancelled projects
2,374
24.5%
Near nothing on her list
4,220
43.6%
No usable zip code
5
0.05%
482 reports, 5.0% of 9,683, sit near an operating facility and no listed project of another status. They come from 128 zip codes. 333 are near exactly one operating facility; 149 are near two or more. The other 602 of the 1,084 reports near an operating facility are also within 10 miles of a project that isn’t operating; 28 of those are near only a cancelled one. If cancelled projects don’t count, the operating-only count is 510, 5.3%. Measured against the 5,458 reports within 10 miles of anything on her list, rather than all 9,683, 482 is 8.8%.
Status
Facilities
Reports within 10 miles (non-exclusive)
Mean
Median
Facilities with none
Operational
139
1,974
14.2
11
7
Under construction
166
2,967
17.9
13
9
Proposed
175
2,499
14.3
8
21
Permitted
39
783
20.1
16
2
Cancelled
26
378
14.5
9
3
72 of the 139 operating campuses have no listed project of another status within 10 miles of the campus itself; 510 distinct reports sit within 10 miles of at least one of them. That isn’t the same group as the 482. The operating-only test looks at what is within 10 miles of each report; this count looks at what is within 10 miles of each campus. 441 reports are in both. The other 69 of the 510 are near one of those campuses and also near a non-operating project that is more than 10 miles from the campus. The other 41 of the 482 are near only operating campuses that each have a non-operating project within 10 miles of the campus but not of the report. That the 510 equals the operating-only count without cancelled projects is a coincidence. Only 40 operating campuses have no other listed facility of any status within 10 miles, and 330 distinct reports sit near those.
At 25 miles, the buckets shift to 2,312 near an operating facility, 4,800 near only other listed projects, and 2,566 near nothing on the list.
What the numbers do and don’t show
The numbers rest on two things the files don’t document: how each zip code’s point was chosen, and whether a report’s zip code is the reporter’s or the reported site’s. Her form asks for both the reporter’s address and the “AI Data Center Location You Are Reporting” [4]. If the zip is the reported site’s, distance roughly says which project a report is about; if it’s the reporter’s, it says how far the reporter lives from the nearest listed project. The file can’t settle which. Proximity says nothing about which facility a report concerns or what prompted it, and the 5% is a share of submitted reports. A rate of filing would need the population inside each circle, which her files don’t carry and I didn’t compute.
Counted by bucket, more reports sit near projects that aren’t operating, 4,374 or 45.2%, than near operating facilities, 1,084 or 11.2%. Another 4,220, 43.6%, sit near nothing on her list. Counted per facility, operating campuses average 14.2 reports within 10 miles, the same as proposed projects at 14.3, with a higher median, 11 against 8. The operating-only test removes 602 of the 1,084 reports near operating facilities because a non-operating project is also within 10 miles; 67 of the 139 operating campuses have one.
The bucket labels can also mislead in the other direction. Ahwatukee, in Phoenix, zip code 85044, has 18 reports in the operating-only group because Digital Realty’s operating PHX15 is within 10 miles. One of them, dated April 6, 2026, names Menlo Equities as the owner and describes “a million square foot AI center” less than half a mile from the writer’s house. Five others carry only the note “pics,” and 12 have no owner or note. Menlo Digital’s 38-acre Ahwatukee data center has been under construction since April 2026 [6], and it isn’t on her list within 10 miles of that zip code. The April 6 report is about that construction site, and the test files it as operating-only. The other 17 say nothing about which facility they concern, so neither the test nor I can place them.
A zip code’s coordinate can sit miles from a rural reporter’s home, and the size and direction of that error vary from place to place. Her list covers major AI and hyperscale facilities and leaves out many smaller ones [4], so “near nothing” means only that no listed facility is within 10 miles. The omitted facilities skew older, smaller, and already running, so their absence pushes the operating-only share down. A share of submitted reports also can’t count neighbors of a running facility who have never heard of her map. Reports also track approval fights: neighbors organize when a project is proposed, so a map built from voluntary submissions will cluster around proposals, whatever happens after a facility opens. The test measures distance only. It doesn’t measure noise, light, wells, water supply, or electricity costs.
Across every whole-mile radius from 1 to 30 miles, the operating-only share runs from 1.2% at 1 mile to a peak of 5.3% at 6 miles, or 5.4% if cancelled projects don’t count, then mostly falls as wider circles catch more new projects. Below about 3 miles, the circles get smaller than many zip codes, so a report’s assigned point may say little about where the reporter or the site is; I’d give those radii little weight. At 5 miles, it’s 442 reports, 4.6%. At 10 miles, it’s 482, 5.0%. At 25 miles, it’s 211, 2.2%.
The code
The code is here so anyone can check the numbers. One block of JavaScript reproduces every figure above from the three archived files [1][2][3]. Read it before you run it: it only downloads those three files and counts. Open any page on web.archive.org, for example, the archived stats page [5], open the browser’s developer console, and paste it. Your browser may ask you to type a confirmation before it accepts pasted code; that warning is there for good reason, so run only code you’ve read. Change RADIUS to rerun at another distance, and set CANCELLED_COUNTS to false to leave cancelled projects out of the operating-only test.
// Settings. RADIUS is in miles. CANCELLED_COUNTS: true counts a cancelled project as a non-operating project nearby.
const RADIUS = 10, CANCELLED_COUNTS = true;
// Archived inputs (October 10, 2026 captures). To use her live files instead, run on brockovichdatacenter.com
// and set FILES to ['/community-reports.json', '/data-centers-map.json', '/zip-geocodes.json'].
const FILES = [
  '/web/20261010001606id_/https://www.brockovichdatacenter.com/community-reports.json?v=20261004',
  '/web/20261010001606id_/https://www.brockovichdatacenter.com/data-centers-map.json?v=20260927',
  '/web/20261010001607id_/https://www.brockovichdatacenter.com/zip-geocodes.json?v=20260927'];
const [all, fj, g] = await Promise.all(FILES.map(u => fetch(u, {cache: 'no-store'}).then(r => r.json())));
const reps = (Array.isArray(all) ? all : Object.values(all).find(Array.isArray))
  .filter(r => (r.date || '') <= '2026-10-04');
const fac = fj.fac;
const R = 3958.8, rad = x => x * Math.PI / 180;
const hv = (a, b, c, d) => { const dl = rad(c - a), dn = rad(d - b);
  const h = Math.sin(dl / 2) ** 2 + Math.cos(rad(a)) * Math.cos(rad(c)) * Math.sin(dn / 2) ** 2;
  return 2 * R * Math.asin(Math.sqrt(h)); };
const near = (p, f) => hv(p.lat, p.lng ?? p.lon, f.lat, f.lon) <= RADIUS;
const order = ['operational', 'under_construction', 'permitted', 'proposed', 'cancelled'];
const nonOp = f => f.s !== 'operational' && (CANCELLED_COUNTS || f.s !== 'cancelled');
const buckets = {}; let noZip = 0, opOnly = 0, opAndNonOp = 0, opOnlyMulti = 0;
for (const r of reps) {
  const z = g[r.zip]; if (!z) { noZip++; continue; }
  const b = order.find(s => fac.some(f => f.s === s && near(z, f))) || 'none';
  buckets[b] = (buckets[b] || 0) + 1;
  if (b !== 'operational') continue;
  if (fac.some(f => nonOp(f) && near(z, f))) { opAndNonOp++; continue; }
  opOnly++; if (fac.filter(f => f.s === 'operational' && near(z, f)).length > 1) opOnlyMulti++;
}
const zc = {}; reps.forEach(r => { if (g[r.zip]) zc[r.zip] = (zc[r.zip] || 0) + 1; });
const within = f => Object.keys(zc).reduce((n, z) => n + (near(g[z], f) ? zc[z] : 0), 0);
const distinct = list => Object.keys(zc).reduce((n, z) => n + (list.some(f => near(g[z], f)) ? zc[z] : 0), 0);
const perStatus = {};
for (const f of fac) { const p = perStatus[f.s] ??= {facilities: 0, reports: 0, counts: []};
  const n = within(f); p.facilities++; p.reports += n; p.counts.push(n); }
for (const s in perStatus) { const c = perStatus[s].counts.sort((a, b) => a - b);
  perStatus[s] = {facilities: c.length, reportsNonExclusive: perStatus[s].reports,
    mean: +(perStatus[s].reports / c.length).toFixed(1), median: c[Math.floor(c.length / 2)],
    withNone: c.filter(x => x === 0).length}; }
const op = fac.filter(f => f.s === 'operational');
const noNonOpNearby = op.filter(f => !fac.some(o => nonOp(o) && near(f, o)));
const nothingNearby = op.filter(f => !fac.some(o => o !== f && near(f, o)));
({reports: reps.length, noZip, buckets, opAndNonOp, opOnly, opOnlyNearTwoOrMoreOperating: opOnlyMulti,
  share: (100 * opOnly / reps.length).toFixed(2) + '%', perStatus,
  operatingWithNoNonOperatingNearby: noNonOpNearby.length, distinctReportsNearThem: distinct(noNonOpNearby),
  ofThoseAlsoOperatingOnly: Object.keys(zc).reduce((n, z) => n + (noNonOpNearby.some(f => near(g[z], f))
    && !fac.some(f => nonOp(f) && near(g[z], f)) ? zc[z] : 0), 0),
  operatingWithNothingElseNearby: nothingNearby.length, distinctReportsNearThose: distinct(nothingNearby)});
On her own site, with the live file paths swapped in, the same code reads her current files. The date filter keeps the reports to the October 4 set, but the facility statuses will be whatever the file says that day.
Closing
Her report form already asks whether the facility is “already up and running” or under construction [4]. The published reports file doesn’t include that answer. Publishing it, or a facility identifier with each report, would let anyone separate reports about operating sites from reports about proposals without estimating from distance.
I’m CTO of DNA Communications and co-founder of FD-IX, an internet exchange, with roughly 20 years in ISP and network infrastructure in Northern Illinois. I have no financial interest in any data center project.
TL;DR
Brockovich’s map headline number, 9,683 reports as of October 4, is not a count of data centers. Her own vetted list holds 545 projects, only 139 of them operating. 80.5% of the published report records carry no owner or note, only a date, a location, and a facility type, and her largest hotspot, 402 reports, is a project with no building and no committed developer.
1,084 reports, 11.2%, come from zip codes within 10 miles of an operating facility on her list, and 482, 5.0%, from near one with no listed project nearby that isn’t operating. 20.7% sit near a campus under construction. Her list leaves out most conventional data centers, and distance can’t say which facility a report is about. Counted per facility, operating campuses average about as many nearby reports as proposed projects.
Of the operating facilities discussed in this piece, four show documented harm, all of it noise, on different kinds of evidence. An Oregon nitrate settlement came with denied liability and a causal share no one has established. The largest open case, xAI’s gas turbines powering its Memphis-area AI campus, is in court: a judge has ruled the turbine plant wasn’t exempt from air permits, and no remedy or penalty has been decided. Much of the rest is construction-phase risk common to any large project, or concern about facilities not yet built.
She told Bill Maher an average golf course uses 500 million gallons a year. By my calculation from the Golf Course Superintendents Association of America (GCSAA) national survey, the mean is at most about 38 million per facility, so she was off by at least 13x. Her figure for the largest campuses, up to 1.5 billion gallons a year, is accurate, even conservative: Google’s biggest site withdrew 1.75 billion in 2025. Cooling water use can be zero: Microsoft’s new designs use none.
Nondisclosure agreements (NDAs) during site selection are real and documented: researchers found them in 25 of 31 Virginia localities with data center activity, and a Houston economic development official said virtually every company scouting that region seeks confidentiality.
Her own site corrects two exaggerations popular with data center opponents, calling the claim that a ChatGPT query uses ten times the energy of a Google search “outdated” and “AI will collapse the power grid” an overstatement. It labels the industry’s 100% renewable claim nuanced. Her farmland and drought claims are accurate.
How this was checked, and what it doesn’t cover
This piece checks three sources: Brockovich’s July 31, 2026 appearance on HBO’s Real Time with Bill Maher [1], her site brockovichdatacenter.com, and her other public statements where they surfaced in national coverage. I treat government records, peer-reviewed research, and court rulings as authoritative. A court filing tells you what someone alleges, not what happened. I use secondary sources to locate primaries and label them where they’re all I found. I use her site’s figures as of its October 4, 2026, update and cite archived copies, because the live pages keep changing [2]. Where the July 30 snapshot that prompted this piece differs, I give both.
I checked the locations that surfaced through national coverage and her own top-reported-cities list. That sample skews toward whatever is most newsworthy. It is not a census of every operating facility in the country. When I say I didn’t find something, I mean I didn’t find it in what I checked.
What Brockovich gets right
Brockovich’s “Facts vs. Myths” page corrects two claims popular with data center opponents and treats an industry claim more fairly than opponents usually do [3]. It labels the viral claim that a ChatGPT query uses ten times the energy of a Google search “outdated,” citing a reassessment that puts a typical query in the same range as older search estimates [4]. It calls “AI will collapse the power grid” an overstatement. It marks the claim that data centers run on 100% renewable energy as nuanced rather than false, since renewable energy credit accounting makes it technically true, and explains what that accounting doesn’t guarantee. It gives closed-loop cooling a fair hearing. Asked on the same page whether data centers bring real jobs and tax revenue, she acknowledges the tax revenue and construction jobs and notes that a large facility may employ only 20 to 50 full-time workers [3]. Elsewhere she has said plainly that she isn’t “making a blanket argument against data centers”; her target is projects announced after permits are secured and NDAs signed before residents hear about them [5].
On air, she gave Maher the same courtesy. When he raised golf and almond irrigation as bigger water users, she said the comparison holds for small and medium-sized facilities, called it “great question, good argument,” and narrowed her case to the largest campuses [1]. Her bipartisan claim checks out: Oklahoma’s Data Center Customer Ratepayer Protection Act carried 36 co-authors from both parties and a Republican governor’s signature [6], and her legislation tracker, which cites a named source for every entry, shows comparable bills in Florida and South Dakota alongside New York, Maryland, and Washington [7]. Her Noise Impact Simulation labels itself an illustrative model, not measured data, and its advice to residents is sound: ask for an independent acoustic study, ask about low-frequency noise below 200 Hz, and insist on measurements at the property line [8]. Her News page’s claim that a West Virginia flood was caused by data center construction is also substantiated: a silt-retention breach during earthwork in Mason County sent water and sediment onto nearby homes [9][10].
Brockovich’s specific claims, checked
Each entry leads with a verdict: Accurate, Overstated, Imprecise, or Unverified. Where a claim has two parts, each part gets its own.
Water: Accurate on the largest campuses, Overstated on the golf baseline. Up to 1.5 billion gallons a year is a real figure for the biggest campuses. Google’s thirstiest site, Council Bluffs, Iowa, withdrew 1.75 billion gallons in 2025 and consumed 1.35 billion of it, according to Google’s own environmental report [11]. Withdrawal is what a site draws from its source. Consumption is the part that doesn’t go back, mostly lost to evaporation. A data center can use no water for cooling. Since August 2024, all new Microsoft data center designs use no water for cooling beyond filling the closed loop, though the buildings still use water for restrooms and kitchens [12]. The 1.5 billion number belongs to the largest sites, not to the industry. These are direct, on-site figures. They exclude water consumed at the power plants supplying the electricity, and a dry-cooled campus shifts some of its water footprint there by using more electricity.
The golf baseline she used is wrong. She told Maher an average golf course uses 500 million gallons a year. GCSAA’s 2024 national survey reached 13,952 golf facilities and drew 1,766 responses. It projects national irrigation at 1.63 million acre-feet by multiplying each region’s mean use per facility by the number of facilities in that region [13][14]. The projection uses only responses based on water-meter readings [14]. Spread across the 13,952 facilities the survey reached, it works out to about 38 million gallons per facility. GCSAA doesn’t publish the facility count behind the projection, and the true count can’t be smaller than the number of facilities the survey reached, so 38 million is an upper bound on the national average. A facility can be a 9-hole course or a 36-hole club, so individual courses vary around that. Southwest courses use more than double the per-facility water of other regions [14], and even Google, when it converts its data center water into “golf course equivalents,” uses a southwestern course at about 150 million gallons a year [11]. Her 500 million is more than three times that and at least 13 times the national average. The correction helps her argument rather than hurting it. Against that average, Google’s largest campus by water use withdraws at least 46 times what a typical facility does [11]. Her version made them look comparable.
NDAs: Accurate in substance, Overstated in scope. Confidentiality during site selection is common in corporate relocation. A Houston economic development official said virtually every company scouting the region seeks confidentiality [15]. In DeKalb, the 560-acre campus first came before the public as “Project Vector,” filed by a developer rather than the eventual operator [16]. Brockovich’s “everything, everything” claims more than the record shows. Two researchers who filed public-records requests found NDAs in 25 of 31 Virginia localities with data center activity, about 80%, and say the real figure may be higher because some governments kept no copies [17]. That documents NDAs in at least 80% of the localities they checked. The researchers couldn’t settle the rest either way. Public Citizen, an advocacy group opposed to data center NDAs, cites the same 80% from the same source [18]. The sharper complaint isn’t that NDAs exist. It’s that some keep figures out of public view that the public would normally see. In Botetourt County, Virginia, the regional water authority blacked out how much water a Google data center would use, citing an NDA, and released the figure, 2 to 8 million gallons a day, only after court rulings in a local news outlet’s favor [19]. Records for a Google project in Douglas County, Georgia came back with the water requirements redacted [20]. That’s the version of the complaint that holds up, and it’s a question to ask about any local deal.
She has a stronger local-control example available and doesn’t use it. West Virginia’s HB 2014 exempts certified high impact data centers and microgrid districts from county and municipal zoning, noise, and lighting ordinances [21][22]. That isn’t a private agreement. It’s a state legislature removing a county’s authority over a facility inside its own borders.
“It’s taking farmland”: Accurate. In DeKalb County, Illinois, every data center site, built or planned, was in crop production until development started. The loss is permanent. It also needs scale. The three DeKalb projects total roughly 1,200 acres, about 0.34% of the county’s 353,524 acres in farms [23]. The county lost about 5% of its farmland between 2017 and 2022 to all causes combined [23]. The newest site followed the city’s own plan: the 2022 Comprehensive Plan designates it industrial, and when the county’s enterprise zone was expanded, the Illinois Department of Agriculture found that including the property was consistent with the state’s farmland preservation policy [24]. The council then annexed and rezoned it in December 2025 [25]. Her claim is true. Whether farmland is a bigger concern for a data center than for the warehouse or factory that would otherwise sit on that edge of town is a separate question.
“Building them on drought-restricted land… Iowa, Nebraska, Kansas”: Accurate on conditions. When she said it at the end of July, nearly 84% of Nebraska was in drought on the U.S. Drought Monitor, including areas of extreme and exceptional drought [26]. A large area of southwest Kansas was in moderate to severe drought [27]. About a third of Iowa was in moderate drought in early July, concentrated in the north and west [28]. Those are statewide and regional drought classifications, not water-use restrictions on specific parcels. Whether drought explains why particular sites were chosen is a different claim, taken up in the siting section.
Acreage: Accurate for the largest projects, Overstated as a description of the category. Meta’s Hyperion campus in Louisiana started at 2,250 acres, and Meta bought another 1,400 at the end of 2025, about 3,650 in all [29]. The three DeKalb projects run 132, more than 500, and 560 acres [30][31][32]. Headline acreage also usually describes a project boundary rather than buildings. The Stratos project in Box Elder County, Utah, was billed at about 40,000 acres, split into three sites, with the non-data center land earmarked for uses that may include manufacturing, retail, restaurants, and hotels [33]. Utah’s governor said the first-phase permit holds the data center building footprint to under 2,000 acres, about 5% of the original total, and that later phases would need their own approval [34]. In June, the developer dropped about 20,000 acres and said the campus will likely be 10,000 acres or less [35]. When a number like 4,000 acres describes “a data center,” ask whether it’s typical, the biggest ever built, or mostly land that won’t be built on.
“We’ve always had data centers. They’re generally smaller”: Accurate, with a caveat. Most older data centers are smaller, and the gigawatt tier is new. Big older ones exist, though. 350 East Cermak in Chicago, a 1912 R.R. Donnelley printing plant converted to telecom use in 1999, runs about 1.13 million square feet with 109 megawatts (MW) of utility power [36][37]. Edged opened the first 24 MW building of its 96 MW campus in Aurora, Illinois, in February 2025; its second building alone is rated 72 MW [38][39]. Stargate Abilene had 618 MW of computing (IT) capacity delivered across six of its eight buildings as of September 10, 2026, according to Oracle [40]. The campus is planned at 1.2 gigawatts (GW), or 1,200 MW [41], about 11 times Cermak’s utility power, and that tier is the one this debate is actually about. It didn’t appear overnight. An industry analyst firm that tracks hyperscale capacity says the average size of new data centers increased gradually for years before accelerating sharply in late 2024, and the number of hyperscale facilities reached 1,136 at the end of 2024 after doubling over five years [42]. Getting from Cermak to Abilene took steadily larger campuses, not a leap from one kind of building to another. The bigger change is architectural. Cermak is a multi-tenant building in a dense urban core, with dozens of companies running their own equipment in a retrofitted high-rise. A modern AI campus is usually one operator’s purpose-built system on open land, with room for substations and cooling plant.
“People are losing their wells”: Accurate as a complaint, Unverified on cause. Four families near Meta’s Newton County, Georgia data center sued Meta in Gwinnett County Superior Court at the end of August [43]. Meta moved the case to federal court in Atlanta on October 16, and on October 28 the families filed an amended complaint and asked the judge to send the case back to state court [44]. Their central claim is that blasting and excavation during construction pushed sediment into the aquifer feeding their wells; the suit also alleges noise, light, and air emissions. Meta acknowledges limited blasting about 1.1 miles from one family’s property, but says a study by outside experts found the data center is “not likely to be the cause” of the well problems, that groundwater flows away from the homes, and that every gallon the facility used came from the local utility [45]. That dispute is unresolved, and its core is a construction claim, which belongs with the construction section below. Among the cases checked for this piece, none documents an operating data center drawing down neighbors’ wells.
“I now have nine other countries reporting”: Unverified. Her FAQ and stats page describe a U.S.-only map, and neither shows any international data [46][2]. That doesn’t rule out reports she has received and not published.
“New York has banned it”: Imprecise. Executive Order 62, signed July 14, 2026, directs the Department of Environmental Conservation to hold in abeyance discretionary permit applications for building or expanding data centers that use 50 MW or more, excluding manufacturing, research, education, and medical uses. Applications the department had already determined complete before the order are outside the hold, and it doesn’t touch local-government permits. The hold lasts until the state completes a generic environmental impact statement, with no fixed end date [47]. It’s a temporary state permitting hold, not a ban.
“79 municipalities had moratoriums or bans” when she started: Unverified, plausible. The National League of Cities counted at least 76 local governments that had attempted a moratorium or ban when it released its tracker in August [48]. By its October 28 refresh, the tracker listed 218, counting each locality once, with 183 of them adopted or completed [49]. Her own tracker now puts local moratoriums and bans at more than 300 as of September, up from 116 in June, citing SemiAnalysis and Route Fifty [7]. The trackers use different dates and definitions, and a tracker’s count also grows as it catalogs more entries, so these figures don’t show a growth rate. 79 falling between them makes it plausible, not verified.
Maher’s claims, checked
Maher got one of his four checkable claims right, had the direction right on a second, was partly right on a third, and was imprecise on the fourth.
“I don’t think it’s the land. We have the land”: Accurate. Land is not what constrains data center siting nationally. Power availability is, and CBRE calls it “the foremost site selection criterion for greenfield data center developments” [50]. Maher identified the correct binding constraint in an offhand remark.
“Seven times the amount of water” goes to golf: Understated today. Golf’s national water use, about 531 billion gallons a year from GCSAA’s survey [13], is about 30 times data centers’ direct consumption of 66 billion liters, about 17.4 billion gallons, in 2023 [51]. LBNL’s 2028 projections, 325 to 580 TWh at a site water intensity of 0.45 to 0.48 liters per kWh, work out to roughly 39 to 74 billion gallons [51]. With golf flat or declining, the ratio falls to 7x to 14x. Maher had the direction right and lowballed today’s gap; his number describes 2028. Both comparisons use direct, on-site water only. One caveat on the accounting: GCSAA measures irrigation applied, and some of that soaks back into the ground or runs off, while LBNL’s figure is water consumed. Golf’s consumed share is smaller than its applied total, so the 30x overstates the consumptive gap by an amount neither source measures. It doesn’t close it. The totals also hide a per-unit trend both industries share. Golf’s total use fell 31% since 2005 while the number of facilities fell 14%, so use per facility fell about 20% [14]. Microsoft’s water-use effectiveness, a measure of water per unit of energy, improved 39% from 2021 to the figure it reported in December 2024, and about 80% since its first-generation facilities [12]. Those are different measures, golf per facility and Microsoft per unit of energy, but both show efficiency improving while total demand can still rise as data center computing grows.
“Why don’t we build them in our 51st state where it’s cold?”: Partly right. Brockovich answered, “Well, absolutely” [1]. Cold climates do cut cooling load. Dry coolers work best where outside temperatures stay below about 80°F, which favors northern sites [52]. But climate doesn’t outrank power. A cold site without transmission capacity and fiber doesn’t get built [50].
“A $500 billion data center”: Imprecise. $500 billion is the total, multi-year Stargate program across seven planned sites [41]. The flagship Abilene site sits on just over 1,000 acres [53]. Its developers formed a $15 billion joint venture to finance the eight-building, 1.2 GW campus [54], and Oracle is reportedly set to spend about $40 billion on Nvidia chips for it [55]. No total cost for the site is published, but those two figures together are about a ninth of the headline number.
Maher also asked the sharpest question of the segment. After she said New York had banned data centers, he asked whether New Yorkers would still use what data centers produce: “Everybody’s a hypocrite. Oh, we can’t have it, but I will use it.” She answered “Well, yes,” pivoted to where data centers should go, and he didn’t press [1].
The map: what’s checked, and what just has a zip code
Brockovich’s map layers two kinds of data: a vetted list of projects, labeled by status, and a layer of community reports. Only the second produces the headline number, and no individual report on it is tied to a facility or a status.
As of its September 27 update, the vetted layer lists 545 projects: 139 operational, 166 under construction, 175 proposed, 39 permitted, and 26 cancelled, drawn from two open datasets, Compute Atlas and Epoch AI [56]. It covers major AI campuses and isn’t complete: of the three DeKalb projects, only Meta’s is on it. The “Community Reported” layer is something else, and it produces the headline figure: 8,837 on July 30 in my screenshot of the map, and 9,683 on October 4 [2].
“Does every ‘Community Reported’ data point represent an AI data center? No. Reports fall into several categories: AI data centers already operating, facilities under construction, and rumored or proposed projects.”brockovichdatacenter.com, FAQ
That’s her own documentation [46]. A reader looking at the map can’t tell which category a pin belongs to. By her own description, each report is read; reports without a zip code, city, or enough detail aren’t plotted; and duplicates are removed [46]. Nothing in that description checks whether a report describes a real facility.
The volume clusters hard. Across 2,447 zip codes, the average is about 4 reports. Her top 20 cities total 1,540 reports, 16% of the national figure [2]. The remaining 8,143 are spread across the other 2,427 zip codes, most in single digits.
The largest number on the map belongs to a project with no building, no committed developer, and a trial more than a year away. Sulphur Springs, Texas, has 402 reports, more than three times second-place Marshall, Michigan, at 127 [2]. Construction there has been halted amid lawsuits since at least February 2026 [57]. The litigation is a deed-restriction fight between the city and the former landowner, Vistra, plus a resident’s claim that the city violated the Open Meetings Act [58]. None of the litigation concerns water, noise, or health. In June, the mayor announced that MSB Global would no longer lead the project, and, as of July, no replacement had been named [58][59]. In September, the court reissued an injunction barring construction of facilities that generate or store electricity for sale on the property and set trial for November 15, 2027 [60]. CyrusOne held a community meeting that month on a possible campus at the site and says the project is still in due diligence [61][62]. The raw file shows how the count got so high: 158 of the 402 carry the same date, May 1, and 376 carry no note at all [63]. By the file’s own dates, 350 of the 402 arrived in May alone, and 389 were in by May 28 [63]. The count has nearly stopped moving since: comparing the author’s July 30 screenshot of the map with the October 4 stats page, Sulphur Springs added 5 reports while the national total added 846. That fits a one-time burst of filing better than an ongoing stream of new complaints. It also shows how much one town’s filing can move the map: Sulphur Springs alone is 4% of the national total.
A layer called “Community Reported” measures public sentiment, and sentiment about an unbuilt facility is real. In a town of about 17,000 people [64], 402 reports say something true about that community, though the published file doesn’t show whether one person can file more than once.
On air, she introduced the map about 30 seconds after telling Maher that data centers are “very destructive.” Then came “every single state in the United States of America was reporting to me,” followed less than a minute later by “it’s the whole country” and “it’s risking and taking all of that” [1]. She never said the reports document damage. She never drew the distinction her own FAQ draws, either. Heard in that sequence, the number reads to me as evidence of widespread damage, not widespread worry. Those call for different policy responses, and the count can’t tell them apart.
The map also can’t support the case it’s used for. To document harm from operating data centers, it would need reports that can be tied to running facilities. Her site publishes the reports themselves as a data file, so this can be checked. Each record holds a date, a place, a zip code, a type, and optional owner and notes fields. Of the 9,683 records, 7,799, 80.5%, have neither an owner nor a note in the published file: a date, a place name, a zip code, and a facility type, and nothing about what the report concerns [63]. Her FAQ says submissions arrive through a form and each one is read [46], so the submissions may say more than the published file does. The public record doesn’t.
I compared each report’s location to her own vetted list. The site’s zip-code file gives one coordinate for each zip code, and the vetted file gives coordinates for each project. I counted a report as near a project when that coordinate falls within 10 miles of it, and assigned each report to the most advanced project nearby: operating first, then under construction, then permitted, proposed, or cancelled. By that measure, 1,084 reports, 11.2%, are within 10 miles of an operating facility. Another 2,000, 20.7%, are near a campus under construction but no operating one. Another 2,374, 24.5%, are near only proposed, permitted, or cancelled projects, and 4,220, 43.6%, aren’t within 10 miles of anything on her list. Five had no usable zip code.
602 of the 1,084 are also within 10 miles of a project on her list that isn’t operating, and the file doesn’t say which project those reports concern. That leaves 482 reports, 5.0%, near an operating facility and no listed project of another status; if cancelled projects don’t count, it’s 510. Counted per facility, with each report counted once for every facility within 10 miles of it, operating campuses average about 14 reports, the same as proposed projects, and campuses under construction about 18. So operating sites do draw reports. The 5% is small mostly because 67 of the 139 operating campuses on her list have a non-operating project within 10 miles, and the test drops every report that shares a circle with one.
A zip code’s coordinate can sit miles from a rural reporter’s home, and the size and direction of that error vary. Her list leaves out many conventional data centers, so “near nothing” means only that no listed facility is within 10 miles. And proximity says nothing about which facility a report concerns. A resident who has lived next to a running facility for years may never have heard of her map, so a shortage of reports near operating sites isn’t proof of no harm. Reports also track approval fights: neighbors organize when a project is proposed, so a map built from voluntary submissions will cluster around proposals, whatever happens after a facility opens. The distance test only speaks to local effects like noise, light, and wells; electricity costs and water supply reach well past 10 miles. Across every radius from 1 to 30 miles, the operating-only share stays between 1.2% and 5.4%: 442 reports (4.6%) at 5 miles, 482 (5.0%) at 10, and 211 (2.2%) at 25, lower at wide radii because a wider circle catches more new projects. These counts lean low: the test drops every report that shares a circle with another project, and operating facilities missing from her list can’t count at all. More reports sit near projects that aren’t running yet, 4,374 or 45.2%, than near running ones, and the map can’t say which facility any of them concern. The full method, code, and file hashes are in a separate article, “How I Checked Erin Brockovich’s Community-Report Map.”
Leaving conventional data centers off the list also shapes the story. She acknowledged them on air: “We’ve always had data centers. They’re generally smaller” [1]. They’ve operated for decades, and in my experience they draw few complaints, though most of the ones I know sit in urban cores and business parks, not next to farmhouses. Her FAQ is open about the omission: it says more than 4,000 data centers operate in the U.S., many built before the AI boom, and the map isn’t meant to show them [46]. Both of her source datasets track AI compute, not data centers in general. Leaving them off still sets the old record aside: a reader of the map sees the new facilities with nothing to compare them against, including the decades of conventional facilities that, in my experience, drew few complaints. Scale has grown, steadily rather than overnight, as the Cermak comparison above shows. Old and new facilities share the same core parts, computers, cooling equipment, and backup power, while their scale, layout, cooling design, and power supply can differ a great deal.
The complaint categories rest on about 1,600 categorized submissions, not the full total. Her stats page builds them from a keyword analysis: the raw counts behind the percentages (663 water reports at 41.2%) imply that base, and one submission can match more than one category. The same percentages appeared in Fast Company’s coverage on May 28, when the map held 2,716 reports [65], and they were unchanged on October 22 at 9,733 [2]. Identical percentages after the total grew more than threefold mean the categories haven’t been rerun since late May; the site doesn’t say so. With that understood: water leads at 41.2%, then electricity and grid at 22.2%, health at 18.1%, wildlife and land at 14.6%, and noise at 13.7% [2]. Health is the largest category this piece doesn’t otherwise address. Her site’s health claims run through noise: her noise simulation, which she labels an illustrative model of a hypothetical facility, pairs modeled noise levels with “sleep disruption, stress response, cardiovascular risk with chronic exposure” and cites the World Health Organization’s night-noise guideline of 40 dB [8]. This piece doesn’t test those health effects; it checks the noise cases. Her Facts vs. Myths page discusses health through sleep disruption from noise and light at night [3]. The health pathways documented in this piece’s operating cases are noise and emissions from on-site generation, covered below. Claims linking the power lines and substations that serve data centers to childhood leukemia and other disease come from other advocacy groups, which concede that the health effects of electromagnetic fields from data centers specifically haven’t been extensively studied [66]. Property values come in last at 1.2% [2]. That doesn’t settle whether this is NIMBY opposition, since NIMBY concerns include noise, traffic, and neighborhood character, all of which rank higher. It does show that the most directly financial complaint a homeowner could make is the one that shows up least in her own categories.
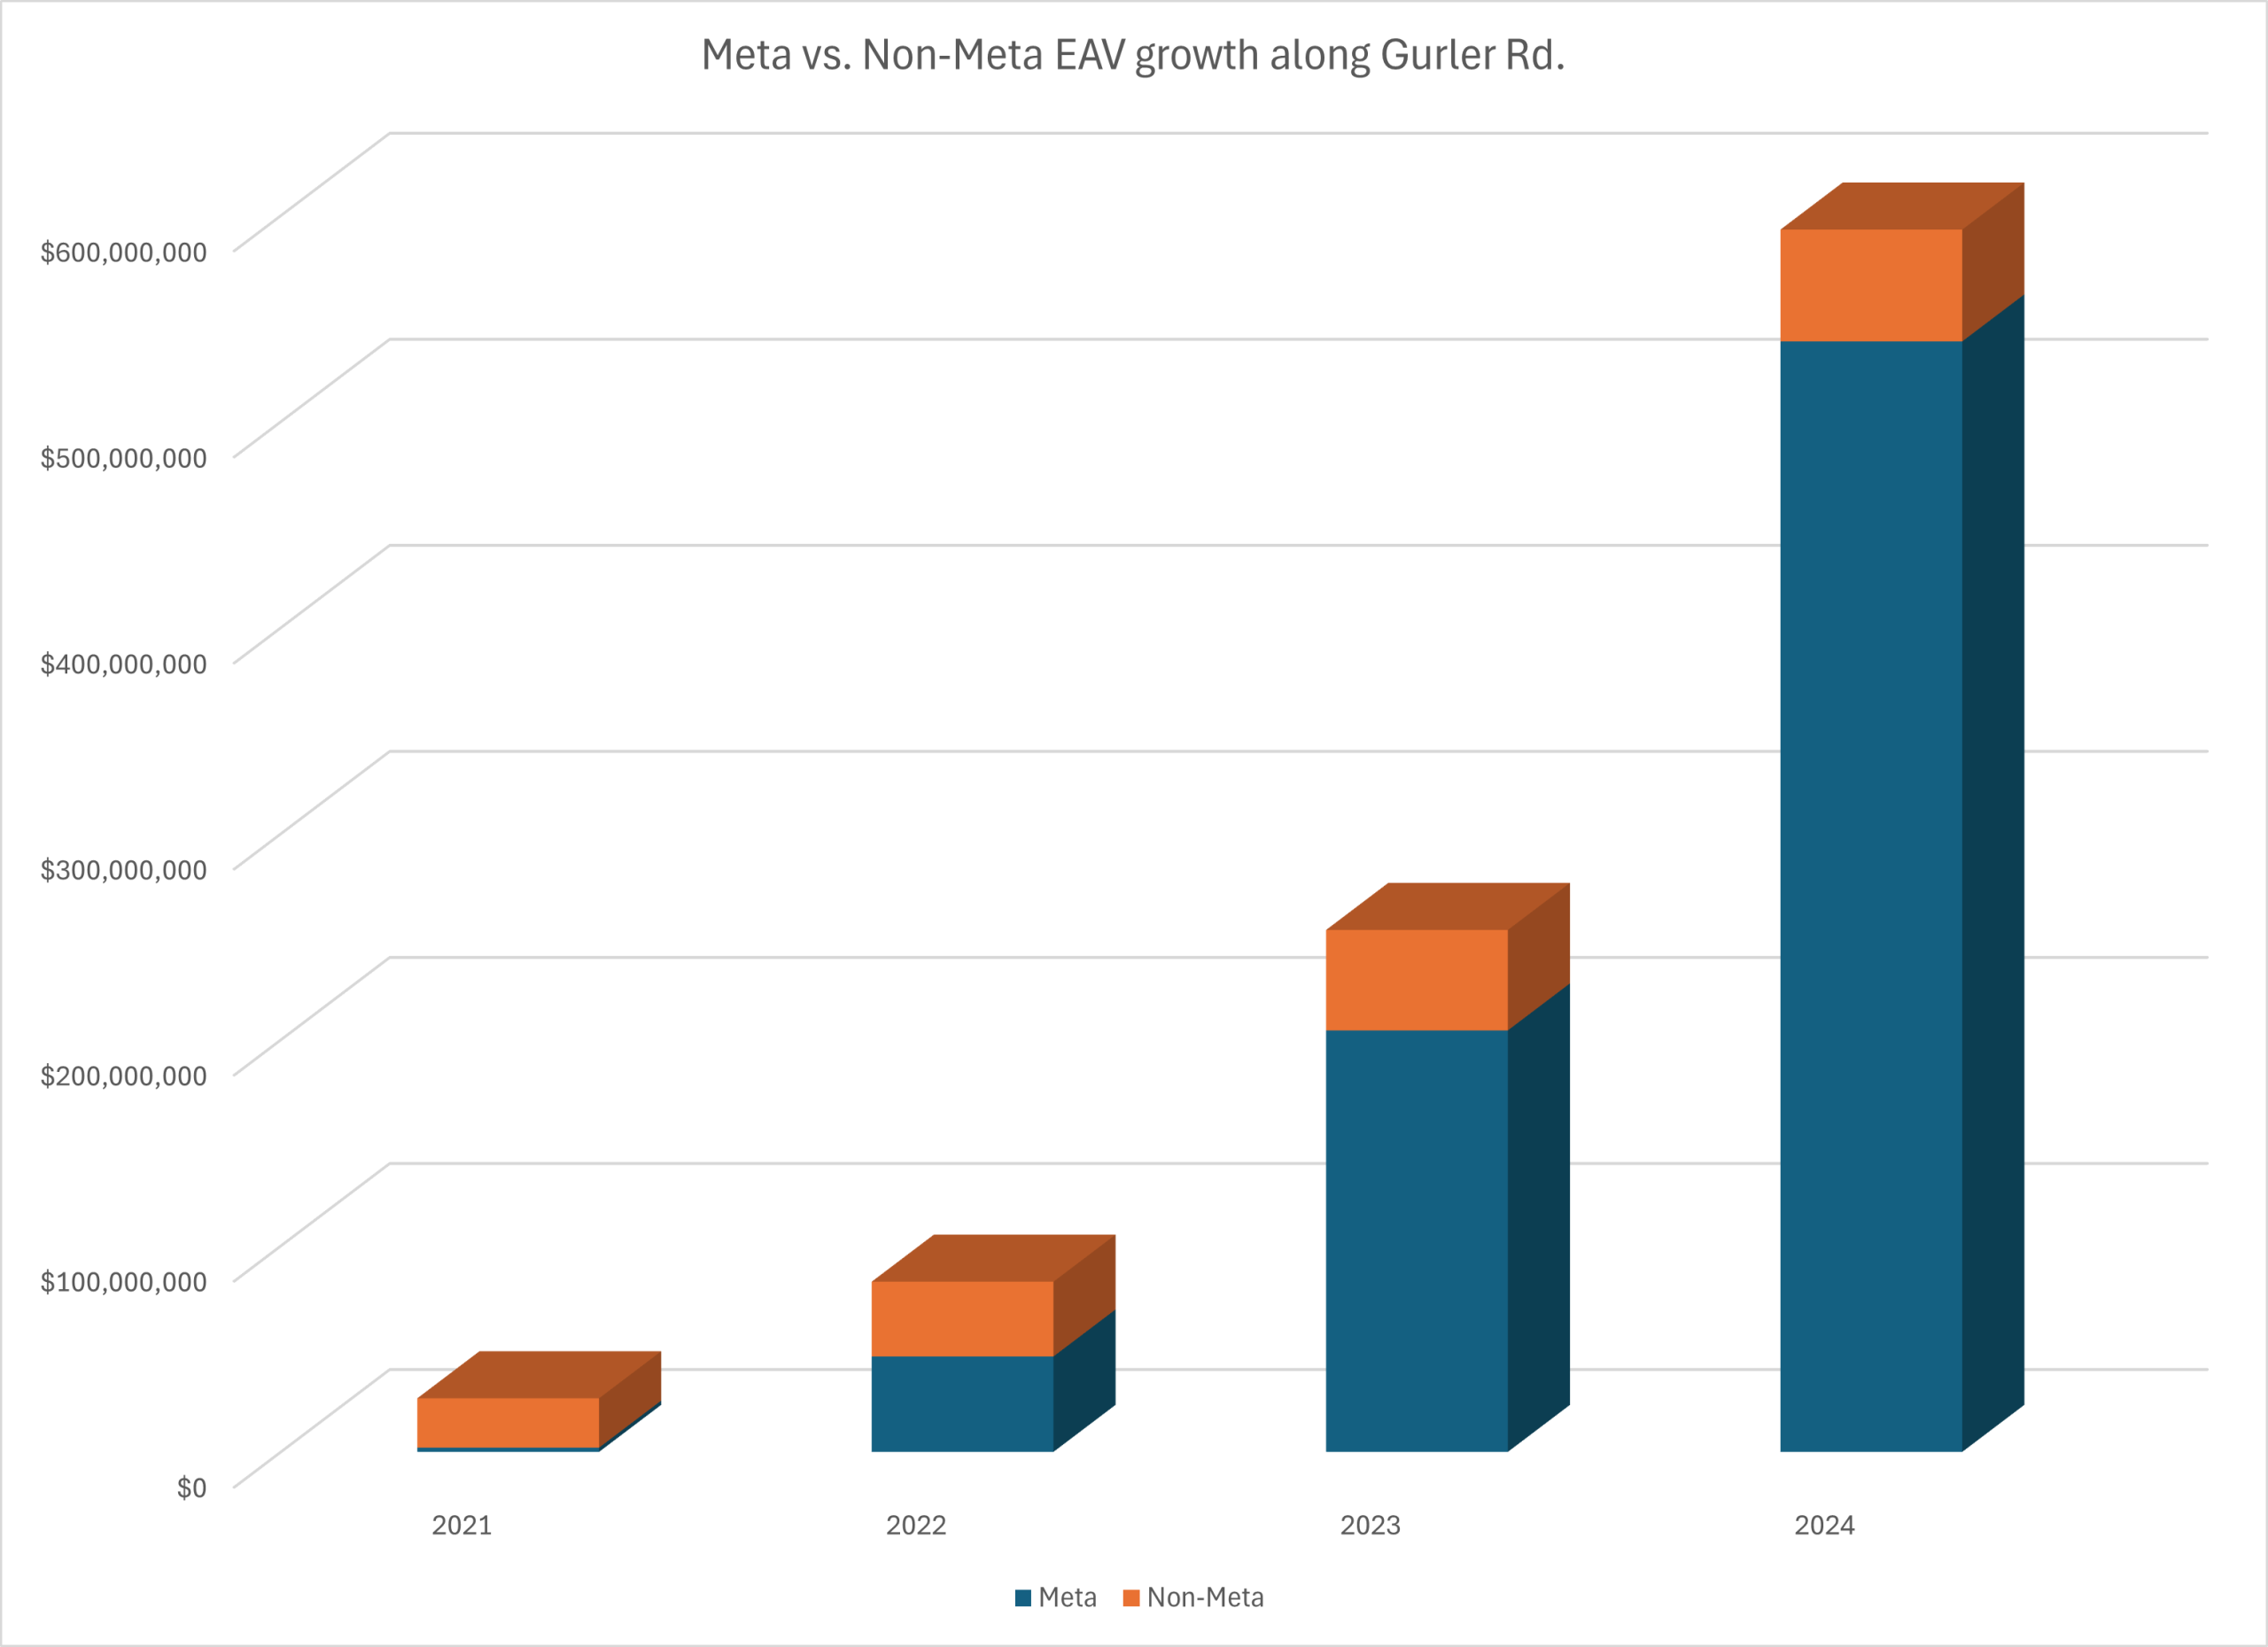
I checked one zip code by hand, my own, and the map can’t say what its reports describe. DeKalb, Illinois, 60115, carries 8 community reports [63]. On the ground, there are three projects. Meta declared its campus, on more than 500 acres, operational in November 2023 [67][31]. The city council approved Edged’s 560-acre campus on December 8, 2025, in Ordinances 2025-050, 2025-051, and 2025-052, covering the development agreement, annexation, and rezoning [25][32]. On July 22, 2024, the council amended Ordinance 2023-038 to allow a seven-building data center on a 132-acre Karis site, after a planning and zoning recommendation a week earlier [68][69]. One of the three is operating. By Meta’s own figures, it withdrew 105 megaliters of water in 2024, about 28 million gallons [70].
In August 2026, DeKalb’s city manager told WGLT that the city hasn’t had to deal with complaints about the operating Meta facility over noise or any other pollution issue, and the reporter who visited called it “completely silent” [71]. That’s a complaint record and one visit, not a measurement, and complaints to a city undercount for the same reasons reports to a map do. The documented objection in DeKalb is to Edged, which hasn’t been built: a resident raised habitat, light, and sound concerns at the December hearing [71].
In her data file, one of the 8 reports in 60115 names Meta as the owner, and the only notes on the other seven say “pics” twice [63]. They could be about Edged, Karis, or the operating Meta campus. The difference matters to anyone trying to use that number. Checking took an afternoon with city council records and one local news story. I haven’t seen anyone do it for the other 2,446 zip codes.
A verification process built on location and duplicates also can’t sort out cause. A report can be accurate about a problem, such as flooding, and say nothing reliable about what caused it.
Construction is not operation
Some of the clearest documented harm in the cases I checked comes from construction, not from a running facility. Her map doesn’t separate the two: about 21% of its reports sit near a campus under construction, and distance can’t say whether they describe the construction or the facility to come. Construction-phase risk is common to any large land-disturbing project.
The West Virginia flooding on Brockovich’s News page is the clearest example. During earthwork at the Monarch Cloud Campus in Mason County, a silt-retention breach sent water and sediment onto neighboring homes in May [9][10]. After heavy rain on July 11 pushed stormwater past the site’s erosion controls again, the state Department of Environmental Protection issued an enforcement order [72]. The developer has pledged to cover cleanup and repair costs [9]. In July, he put his home purchases at 30, about six closed and around 20 under commitment, and the project’s communications team said 38 homes had been bought out [73]. That’s an erosion and sediment control failure. A federal jury in Georgia returned a $135.5 million verdict in 2023 against a solar developer and its contractors for the same failure mode after runoff turned a neighbor’s 21-acre lake into a mud hole [74]. The judge later found the award excessive and ordered a second trial on damages, and in January 2025 the case settled, on terms neither side disclosed, weeks before that trial [75]. Warehouses, subdivisions, highways, and solar farms all produce it. One erosion-control vendor’s analysis put 29% of the solar projects it reviewed at risk of increased erosion [76]. The Georgia well lawsuit above alleges the same kind of construction-phase harm, though there, causation is disputed. Scale matters, and it cuts both ways. The solar developer graded nearly 1,000 acres, according to the lawsuit [75], the size of a large data center campus, and the bigger the disturbed area, the bigger the erosion-control obligation. A data center under construction behaving like any other large construction site is not evidence that data centers are uniquely hazardous.
That doesn’t make construction harm irrelevant to an approval. Developers build big campuses in phases: Edged opened its first Aurora building in February 2025 and topped out its second in 2026 [38][39]. Damaged drainage can outlast the construction. The point is where the fix lives: erosion and sediment control permits, bonding, inspection, and enforcement, the same tools that govern any large site.
Noise works the same way. One resident near a data center under construction in Ahwatukee, in Phoenix, has sent the city about 10 noise complaints since April, describing construction noise early in the morning [77]. The complaint is real, and limits on work hours are enforceable. It’s a different claim from what the facility will sound like once it runs, and both get filed under the same heading.
Siting: what drives it
I found no evidence that developers target vulnerable water supplies. New campuses are going up in states with drought, including the three she named, but drought maps show regional conditions, not why a site was chosen.
Site selection screens on power availability first; CBRE calls it the foremost criterion for greenfield developments [50]. Land, water, and permitting get evaluated within markets that pass that screen. Rural farmland is attractive because it’s cheap, has room to expand, and sometimes comes with water rights and infrastructure from decades of irrigation. None of that requires a drought in the year a site gets picked. Drought status changes from year to year; the power, land, and water rights that drew a developer don’t change with it.
The stronger version of the concern is externality, not malice. Where local water is priced below its scarcity value, ordinary cost minimization pushes demand toward the cheapest input. Whether that depletes a supply depends on withdrawals, recharge, and permit limits. That’s a pricing and permitting problem, and it would produce the same pattern with any water-intensive industry.
Midwest milkweed fell 58% from 1999 to 2010, with the loss of milkweed in corn and soybean fields a major contributor, and Midwest monarch production fell 81% over the same period [78]. Herbicide-treated corn and soybean fields have lost most of the milkweed that monarch butterflies depend on, so the claim that a campus is worse for wildlife than the farmland it replaces can get the baseline backwards. Whether a specific campus improves on that baseline depends on whether its stormwater and buffer areas get native plantings or mowed turf.
The cooling trade-off: water, power, and noise
Cutting a data center’s water use usually costs something on two other fronts.
Evaporative cooling can cut a campus’s electricity demand 25% to 35% at peak summer load compared with dry cooling, according to an operator figure cited in a 2026 preprint [79]. The annual gap is smaller: the same preprint cites one company’s dry-cooled Nevada site running a 6.4% to 10.2% higher annual power usage effectiveness (PUE), the ratio of total facility energy to computing energy, than its evaporative-cooled sister site [79]. Air also holds far less heat than water, so rejecting the same heat with dry coolers takes more fans moving more air, and those fans are where most of dry cooling’s added noise comes from. EPA’s review of dry cooling at power plants names the fans as dry cooling’s largest operating energy load and lists increased noise among its disadvantages [80]. That review covers power-plant cooling, not data centers, so it supports the mechanism, not a noise estimate for any data center. A separate article will cover the engineering.
Microsoft’s Fairwater campus in Mount Pleasant, Wisconsin shows the trade-off in practice. More than 90% of its capacity is cooled by a closed loop that Microsoft says has no evaporation losses, rejecting heat through 172 twenty-foot fans; the remaining servers use outdoor air and switch to water only on the hottest days [81]. Microsoft acknowledged the result on its own site:
Residents to the north of the facility “have noticed a tonal humming sound.”Microsoft website update, April 15, 2026, which tied the sound to the facility’s cooling fans [82]
That’s an admission against interest from the operator, which makes it one of the best-evidenced complaints in this debate. It backs up the humming Maher described on air and Brockovich endorsed, “it’s very disturbing to them and I get it,” more cleanly than anything on her map [1]. The order of events matters. Microsoft adjusted the fans in mid-April and said the facility met the local noise ordinance. In June, it said the mitigations had “fully resolved the issue,” and it has kept working on additional sound reduction since [82]. The village reported no formal complaints after the adjustments [83]. Three residents filed a federal class action on July 1, alleging noise from generators and heating, ventilation, and air-conditioning (HVAC) equipment, including low-frequency sound they say A-weighted (dBA) readings understate [83]. A problem the operator says it fixed, a facility it says meets the ordinance, and a lawsuit can all exist at once. Microsoft made zero-water cooling its standard for new data center designs [12], and Fairwater, in the Great Lakes basin, is mostly built that way. Fairwater doesn’t prove an evaporative design would have been quieter; fan selection, speed, and layout matter too. It does show a mostly zero-water design and a noise problem arriving together in a region where water is comparatively plentiful.
A board weighing a cooling design should ask for its water use, electricity demand, and property-line noise estimates together, because cutting one can raise the others.
What the noise record shows
Noise complaints come in two kinds the map doesn’t distinguish, and the difference isn’t about legitimacy. Anticipating harm is what environmental review, zoning hearings, and permit conditions exist for. Worrying about a facility before it’s built is rational. The problem is counting anticipated harm as experienced harm, which is what happens when both land in the same total.
For a site that isn’t built, a noise complaint describes an expectation, not an observation. In Pittsburg, California, where the city approved an AVAIO Digital data center in November 2024, and opponents were still trying to keep shovels out of the ground in August 2026 [84][85][86], one resident at an opposition meeting described how neighbors form their views: “They read what’s on the outside, you know, different towns, different cities” [87]. That’s a reasonable thing for a resident to do. A dataset shouldn’t count it as a measurement.
Forecasts and observations need different kinds of evidence. For an unbuilt facility, a resident’s concern and a developer’s promise are both forecasts, and both deserve the same scrutiny. What settles either one is a modeled noise study, a stated water source and volume, and conditions written into the permit.
For running facilities, the record is thinner than the volume suggests. As of July, WilmerHale found no data center noise nuisance suit that appears to have reached summary judgment or trial [88]. Cases settle, operators mitigate, and many neighbors never sue. The newest class of campus, gigawatt-scale, dry-cooled, sometimes with on-site gas, is only now coming online: Stargate Abilene had six of eight buildings delivered as of September 2026 [40].
I count a case as documented harm from an operating facility when the operator admits the problem, the operator spends to fix it, or measurements show it. Four of the operating facilities discussed here meet that bar, all on noise. Fairwater rests on the operator’s own admission. An older case in Chandler, Arizona, rests on the operator’s response: in 2018, after neighbors near CyrusOne’s campus petitioned the city over a high-pitched hum from its chillers, CyrusOne spent about $2 million on noise-attenuation blankets. The city said the facility complied with its noise ordinance before, during, and after the work. The retrofit helped, and residents still said the hum bothered them two years later [89][90][91].
Amazon’s facility near the Great Oak subdivision in Prince William County, Virginia, outside Manassas, rests on reported measurements and county records: a real complaint about an operating facility that produced a 10-decibel reduction after 18 months of pressure [92][93]. A March 2025 presentation by a Great Oak resident to the county’s data center ordinance advisory group, posted on the county’s website and made after both fixes were complete, still described the facility as generating continuous low-frequency noise [94]. That’s what a substantiated complaint followed by a partial fix looks like.
The most recent is in Aurora, Illinois, and rests on the operator’s response. In April 2025, a failed transformer at CyrusOne’s campus on Diehl Road put one data hall on nine backup generators for several days, and the company apologized to neighbors for the noise. It then started a campus-wide chiller noise project: temporary walls around the chiller plants in June 2025, then permanent rooftop sound walls and chiller attenuators, described as reducing “noise impacts for nearby residents,” with community meetings along the way. CyrusOne reported finishing that work at two buildings by September 30, 2026, and was still adding measures in late October [95].
A settlement involving a fifth doesn’t meet it. Amazon settled a $20.5 million class action over nitrate contamination in eastern Oregon [96][97]. The case involves operating facilities, not construction. The nitrate problem also predates the data centers. Oregon’s Department of Environmental Quality declared the Lower Umatilla Basin a groundwater management area for nitrate in 1990, decades before the data centers arrived [98]. The other defendants include the Port of Morrow, which oversees the county’s wastewater system; Lamb Weston; large farm and dairy operators; and Portland General Electric. Amazon settled while denying the allegations [96]. With a preexisting nitrate problem and a long list of co-defendants, no one has established Amazon’s share. I don’t count it as documented data center harm, and I don’t leave it out either.
The biggest open operational case isn’t about cooling at all. xAI powers its Colossus 2 AI campus near Memphis with gas turbines at a plant across the state line in Southaven, Mississippi: 69 of them, according to the NAACP’s lawsuit as reported in October [99]. The count has grown as units were added; emails obtained through a public records request put it at 46 in May [100]. Mississippi regulators let the early turbines run without air permits under an exemption of up to a year for temporary, mobile engines, and in March the state permit board approved 41 permanent turbines to replace 27 that had been running unpermitted [101][102]. The NAACP sued under the Clean Air Act. On October 19, a federal judge refused the Justice Department’s request to dismiss the case [99][103], and on October 30 she denied xAI’s own motion to dismiss, ruling that the plant is not a “mobile source” and “was not (and is not) exempted from permitting requirements” [104]. That ruling came on the pleadings. It sets no penalty and orders nothing yet, and the NAACP’s request for a preliminary injunction is still pending. Three residents have also filed a nuisance class action over noise and vibration [105][106]. Backup generators draw complaints too. During a July 2026 power failure, Vantage’s campus in Sterling, in Loudoun County, Virginia, ran on diesel generators. Nearby residents complained to county supervisors about noise and fumes. Vantage says state regulators reviewed its data and found emissions well below permitted levels [107]. On-site generation is an operational issue that belongs in any honest accounting, and it isn’t hypothetical where I live: DeKalb’s Edged campus plans to run on natural gas generators until regional grid upgrades are finished [24].
The litigation, and who benefits from it
A filing is not a finding. Crowell & Moring, a defense firm tracking data center cases, describes plaintiffs’ firms building a replicable complaint, advertising for clients, and filing in multiple jurisdictions at once. It compares the pattern to the growth of litigation over PFAS, the “forever chemicals” [108]. That’s a defense firm’s characterization, but the mechanics aren’t unique to data centers, and they produce volume whether or not a given claim is true.
Readers should know Brockovich’s own ties, as they should know the author’s. Her speakers bureau describes her as a consultant to Weitz & Luxenberg and to Shine Lawyers in Australia [109]. The Weitz relationship dates to 2008 [110]; I found nothing from either firm confirming it’s current, and the firm’s data center page doesn’t mention her. That page solicits clients for data center pollution and noise claims [111]. Her Substack, The Brockovich Report, lists more than 42,000 subscribers, hundreds of them paid [112].
Incentives run the other way too. Developers, site-selection consultants, utilities chasing load growth, and economic development agencies all have money riding on approvals. Their claims about an unbuilt facility are forecasts as well, and they need the same checking.
Electricity and e-waste
Electricity: Accurate. Her site’s figures, about 4.4% of U.S. electricity in 2023 and 7% to 12% by 2028, match the Department of Energy’s 2024 Lawrence Berkeley National Laboratory report, which put them at 4.4% and 6.7% to 12% [3][51]. Her site credits the International Energy Agency for them rather than the LBNL report, but the numbers aren’t inflated. LBNL published an update in June 2026 [113]; the figures she uses match the 2024 edition.
E-waste: no number to check, and that’s to her credit. Her site lists e-waste as a concern without a figure. A newer peer-reviewed estimate puts AI hardware waste at 131,000 to 225,000 metric tons a year by 2030 [114], about 90% below an earlier projection of up to 2.5 million tons a year by 2030 [115]. (That earlier study’s figure of 5 million tons is a total for 2023 to 2030, not a yearly one [115].) For scale, U.S. construction and demolition debris came to about 600 million tons in 2018 [116], more than 90% of it from demolition rather than new building [117]. That doesn’t make AI hardware disposal a non-issue. It does mean her map, which tracks new buildings, isn’t tracking the larger waste stream.
Quick Compare: claims vs. the record
Claim
What was said
The record shows
Average golf course water use
500 million gal/year
At most ~38 million gal/year national average (2024); ~150 million for a southwestern course
Largest campus water use
Up to 1.5 billion gal/year
Accurate; Google Council Bluffs withdrew 1.75 billion and consumed 1.35 billion gal (2025); range starts at zero
Golf vs. data center water
“Seven times” (Maher)
About 30x today; 7x to 14x by 2028
New York policy
“Has banned it”
State permit hold on new 50 MW+ applications pending an environmental study; no fixed end date
Map reports vs. vetted sites
9,683 reports
545 vetted projects, 139 operating; 80% of records carry no owner or note
Map reports near running facilities
9,683 reports, shown alongside operating, planned, and proposed sites
1,084 (11%) within 10 miles of an operating facility on her list; 482 (5%) near one with no non-operating project nearby; the file can’t say which facility a report concerns
DeKalb data center acreage
“Taking farmland”
True; roughly 1,200 acres, 0.34% of county farmland
Quick Compare: national water use, golf vs. data centers
Latest
2028 (projected)
Trend
Golf (national)
~531 billion gal/yr (2024)
Flat or declining
Down 31% since 2005
Data centers (direct, national)
~17.4 billion gal/yr (2023)
39 to 74 billion gal/yr
Rising sharply
Closing
The map Brockovich leads with on national television can show where people are reporting concern. It can’t separate a rumor from an operating facility, a construction complaint from an operational one, or a correct grievance from a misattributed one. In the on-air sequence above, it reads as evidence of nationwide harm, and its own data can’t show that.
The rest of her case mostly holds up. Farmland is being lost, the Plains states she named were in drought, and her one clean numerical miss, the golf baseline, makes her argument stronger once it’s fixed.
A blanket moratorium blocks a well-designed, well-conditioned project as readily as a badly designed one, because it can’t tell them apart. A short, time-limited pause to write standards is defensible where a community has none. Where state law leaves zoning to local boards, as Illinois does and West Virginia no longer does for certified projects, a city council or county board can write them into a special-use permit or development agreement, within what state law allows and alongside the permits state agencies issue: property-line noise limits that cover low-frequency sound, a stated water source and volume, proof of state air permits for any on-site generation, erosion and sediment control bonding, and monitoring after opening with remedies that can be enforced.
Rates and cost allocation sit with the state. Oklahoma’s HB 2992 shows what that looks like, and it bans nothing. It defines a large load as 75 MW or more, requires that costs be allocated under cost-causation principles, with separate tariffs and 10-year terms for large loads, and requires a developer buying land outside a city or industrial park to notify adjacent owners, county commissioners, and the Corporation Commission within 60 days [118]. That goes after cost allocation and secrecy without blocking anything. This piece doesn’t measure how much cost shifting has happened; a future piece will sort which complaints hold everywhere, which hold only at specific sites, and which don’t hold at all.
Her form already asks whether a facility is running or coming soon. A version of the map that published that answer, showed how many reports name a specific facility, and showed the count of distinct facilities alongside the report total would be a useful public tool. She has the audience and the submissions to build it.
Until then, anyone evaluating a project in their own community will get further with city council minutes, state environmental filings, and utility rate cases than with a number from either side. Ask which facility a claim describes, whether it’s built, and whether the complaint is about construction or operation.
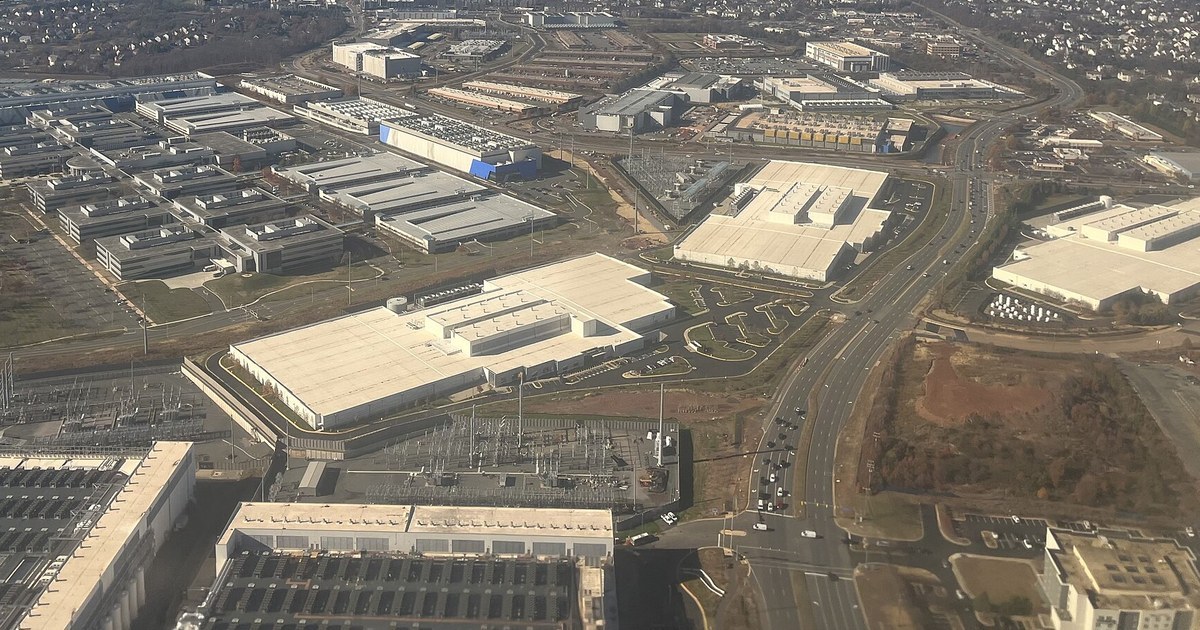
Cover photo: Theodore Christopher / Wikimedia Commons, CC0
[40] Epoch AI, OpenAI Stargate Abilene, AI Data Centers directory (timeline entry for September 10, 2026, quoting Oracle’s Q1 FY27 earnings call: “618 megawatts and 75% of total capacity have now been delivered to the customer”; six of eight buildings): https://epoch.ai/data/ai-data-centers/directory/openai-stargate-abilene
[44] U.S. District Court for the Northern District of Georgia, Morris v. Meta Platforms, Inc., No. 1:26-cv-06273-SDG, docket (removed from Gwinnett County Superior Court, No. 26-A-07974-11; notice of removal filed October 16, 2026, ECF 1; first amended complaint and motion to remand, October 28, 2026, ECF 26 and 27), retrieved from PACER October 29, 2026; public copy: https://www.courtlistener.com/docket/74996593/morris-v-meta-platforms-inc/
[68] City of DeKalb, Planning and Zoning Commission Minutes, July 15, 2024 (recommendation to amend Ordinance 2023-038 for Karis Acquisitions, 132 acres at Peace and Gurler roads, adding data center as a permitted use): https://www.cityofdekalb.com/AgendaCenter/ViewFile/Minutes/_07152024-2555
[79] Small Bottle, Big Pipe: Quantifying and Addressing the Impact of Data Centers on Public Water Systems (preprint): https://arxiv.org/pdf/2603.02705
[114] Vrije Universiteit Amsterdam, New estimate of AI e-waste (university release on Alex de Vries-Gao, Resources, Conservation and Recycling), February 27, 2026: https://vu.nl/en/news/2026/new-estimate-of-ai-e-waste
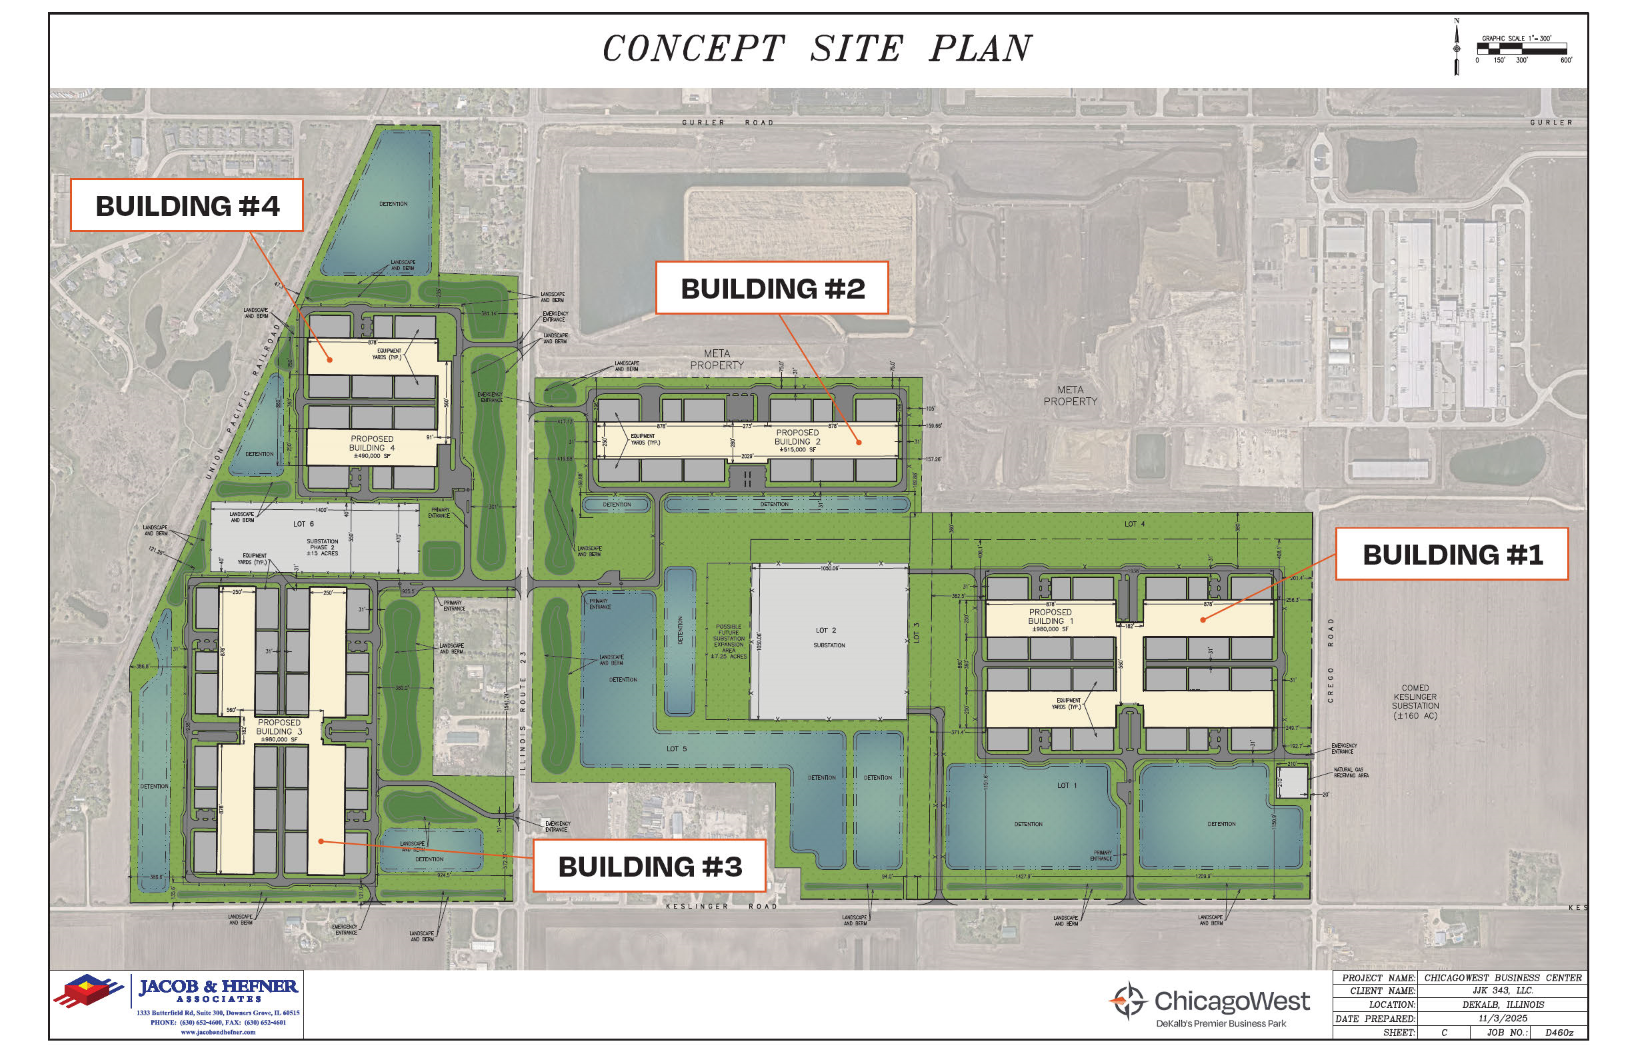
Concept site plan for Edged’s proposed Project Vector, ChicagoWest Business Center, DeKalb, IL. Source: December 1, 2025 Planning and Zoning Commission Agenda Packet.
AI tools were used in the research, drafting, and editing of this article. All factual claims are sourced to primary documents and verified by the author.
How small changes in transparency can prevent delays, diffuse misinformation, and improve community acceptance.
As someone who works adjacent to the data center world – in telecom, fiber, and the broader infrastructure ecosystem – I’ve spent the last few months filling the information vacuum around new data center proposals. Not because I’m in the industry, and not because I attend public meetings (I don’t), but because residents reach out online when they can’t get clear answers from the people actually building these facilities. When a telecom guy becomes the de facto explainer of your projects, it’s a sign that something in your communication approach isn’t matching the scale and impact of the developments themselves.
I’m pro-infrastructure. I want these facilities built. But supporting data centers doesn’t mean overlooking avoidable communication gaps that make your projects harder than they need to be. Consider this tough love – firm because it matters, fair because it’s warranted, and offered because too many good projects are getting delayed or blocked over misunderstandings that never should have taken root.
The Information Vacuum
Most people in any given community are indifferent or quietly supportive of data center development. But when information is sparse, the loudest voices – sometimes just a handful of people – end up defining the narrative. In the absence of clear, early communication from you, residents fill the gaps with whatever they’ve recently read or watched: crypto mines in Tennessee, water disputes in Oregon, diesel controversies in Ireland, AI hype cycles in California, surveillance conspiracies, or grid-collapse speculation that doesn’t apply to PJM territory at all.
These examples aren’t representative of most cloud-style facilities, especially in northern climates, but the public has no way to know that unless you say so. When you wait until the zoning hearing to speak, you’re not guiding the conversation – you’re trying to unwind months of assumptions.
What Communities Need – and What They’re Not Getting
Communities don’t need customer lists or workload diagrams. They understand confidentiality, NDAs, and the operational reality that workloads evolve over time. Customer mixes change, hardware refreshes shift cooling profiles, and what runs in year one may not match what runs in year five. Nobody expects you to freeze your statements in place.
But residents do need basic categorical clarity – enough to distinguish a standard cloud facility from the worst-case examples they’ve heard about. You can safely say:
“This is standard cloud compute.”
“This is not cryptocurrency mining.”
“This is not a large AI training cluster.”
“This supports everyday business and consumer applications.”
These are broad, durable statements. They don’t violate confidentiality. They simply prevent people from assuming that your project is whatever alarming headline they saw last.
Without even this level of clarity, the imagination fills the vacuum – and rarely in your favor.
The Security Inertia Problem
One of the most common complaints I see is what looks like “Fort Knox around a pond.” Site plans often show vast fenced areas protecting empty land, detention basins, or prairie restoration zones far from the operational building. Residents see this and assume something secretive or hazardous is being hidden.
In reality, this is usually design-by-inertia: security measures intended for the building quietly expand outward until they cover land with no operational sensitivity at all. Nobody is trying to compromise national security by accessing your stormwater pond.
Secure the building, loading docks, electrical rooms, and gensets – absolutely. But fencing off dozens or hundreds of benign acres eliminates opportunities to offer genuine community benefit. Those areas could support mixed-use trails, green space, pollinator habitats, agricultural co-use, fishing ponds, or solar co-siting. Instead, they often become unused no-go zones that reinforce the “secret compound” narrative.
This is one of the easiest, lowest-cost opportunities to build goodwill – and it’s consistently overlooked.
The Jobs Story You’re Not Telling
When you say “30 permanent jobs,” residents often assume that’s the entire economic impact. It’s not – not even close.
Direct operational jobs are fewer in number but highly technical: critical-facilities technicians, electrical and mechanical specialists, network engineers, security staff, logistics personnel, and site managers. These roles are well-paid, high-skill, and persist for the life of the facility.
Contractors and construction-phase trades represent the largest share of total employment during the build-out years. Large data center campuses are constructed in phases over nearly a decade, creating recurring waves of work for electricians, pipefitters, welders, plumbers, masons, steel crews, carpenters, crane operators, heavy-equipment operators, HVAC specialists, low-voltage integrators, fiber crews, concrete teams, and many more. These are long, rolling cycles of employment – not short bursts. As Daniel Golding pointed out in a widely read post, many tradespeople deliberately seek out data center work because it’s stable, complex, and long-term.
Ongoing trades work continues after the initial build-out. Facilities still require contractors for electrical modifications, fiber expansions, new circuits, equipment swaps, mechanical upgrades, plumbing work, generator service, cooling adjustments, preventive maintenance, and periodic retrofits. The headcount is smaller than during peak construction, but it never drops to zero.
And the ripple effects matter, too: full hotels, busy restaurants, steady supplier activity, equipment rentals, constant logistics runs, and improved peering/backhaul opportunities for local ISPs.
If you don’t tell this story, people assume a billion-dollar project creates “30 jobs,” and nothing more – a wildly incomplete picture.
Why Operators Must Show Up
Developers often take the heat for decisions they neither make nor control. They get grilled about workloads, cooling strategies, water profiles, power curves, expansion phases, and operational philosophy. But developers don’t own those decisions – operators do.
When operators remain silent due to internal policies or broad NDAs, the developer becomes the face of secrecy. That’s unfair to the developer and unhelpful to the project. To build trust, operators need to participate directly in communication – even briefly – so that answers come from the people who actually know them.
And let’s be honest – this isn’t the Manhattan Project. People move between data center companies all the time. Even if they’re not sharing proprietary documents, the expertise they gained follows them. The things you’re holding back from communities aren’t meaningful competitive secrets. Over-classification doesn’t keep competitors in the dark; it only keeps residents in the dark – and they’re the ones with the power to delay or block your project.
The Role of Utilities and Media
Utilities need to speak plainly. Electric providers should explain load forecasting, substation upgrades, and reliability planning. Water agencies should clarify regional aquifer behavior and seasonal pump profiles. Fiber builders should explain what they’re installing and whether it benefits the community. Natural gas providers should confirm whether anything has changed (often: nothing).
Journalists are part of this dynamic too. Infrastructure is complex, and newsrooms are stretched thin. Reporters aren’t given months to master hybrid cooling systems, grid-planning frameworks, water science, or enterprise architecture. A constructive suggestion: infrastructure reporters should maintain a small bench of trusted technical advisors – the same way health reporters rely on physicians or finance reporters rely on analysts. Advisors don’t tell them what to write; they help ensure the technical context is accurate. Your transparency makes that possible.
Iteration Beats Silence
No one expects perfection the first time. Communication – like software, cooling systems, and operational tooling – improves through iteration. If something doesn’t land, revise it. If a message confuses instead of clarifies, refine it. Communities forgive imperfection when they see honest effort. Silence and defensiveness are what they won’t forgive.
Not everyone is persuadable, but most people are. The goal isn’t to win over the immovable few; it’s to ensure silence doesn’t let them speak for everyone else.
If I’m Wrong About Anything, You Just Proved the Point
I work closer to this ecosystem than most residents ever will. I read zoning packets, utility filings, engineering documents, and planning memos – and even I still have to infer many details because they aren’t publicly explained. If someone like me can’t get a clear picture, residents have no chance.
If I misunderstood anything here, it shouldn’t be taken as bias or malice. It should be seen for what it is: evidence that essential information isn’t being communicated.
You’re building critical infrastructure. Communities deserve to understand it. And you deserve smoother, more predictable, less adversarial project approvals. Those goals aren’t in conflict – but achieving them requires speaking earlier, more clearly, and more consistently, before someone else fills the silence for you.
– Mike Hammett, Author, Data Center Myth-Busting Series
Methods & Transparency
I utilize a range of AI and automation tools, in conjunction with my own research, to organize and verify complex public data – from DeKalb County tax rolls and DevNet parcel records to PJM TEAC maps and ComEd reliability filings. ChatGPT has been the primary workhorse for synthesis, but I also utilize Copilot, Gemini, Claude, and Grok to cross-check facts, refine tone, and develop Python-based tools for analysis. Grammarly keeps the writing clear – I use it for nearly everything I write, even texts.
Over the past several months, I’ve invested well over 100 hours reviewing, verifying, and refining this information. I have also permanently archived more than 100 key source documents in the Internet Archive’s Wayback Machine to ensure transparency and durability. The work is still ongoing as new filings and community feedback come in.
Every figure and citation is sourced from public records that you can verify independently. My goal is to make complex infrastructure and taxation topics accessible and understandable to everyone in the community. I’m just a local guy with a day job and a family, trying to make the public data we already have a little easier for everyone to understand.
Meta’s DeKalb, Illinois data center campus. Source: Meta.
AI tools were used in the research, drafting, and editing of this article. All factual claims are sourced to primary documents and verified by the author.
A fact-checked look at taxes, water, power, and local control
TL;DR: Data-center projects along I-88 have added hundreds of millions in new taxable value – about $200 million in 2024 alone – helping local governments cut tax rates around 20 % while expanding services. Modern campuses use hybrid cooling that cuts water use ~80 %, and Illinois’ grid – increasingly powered by nuclear and renewables – keeps them largely carbon-free. Every project operates under local water caps, noise rules, and open-record laws that ensure community control.
The more technical deep dives on electricity and property taxes are linked below.
A Region in Transition
Cornfields along I-88 have rapidly transformed into billion-dollar data-center campuses. That pace of change has sparked valid questions: Will they drain our water? Overload the grid? Take over farmland or raise taxes?
Those are fair questions – and the public record already has the answers. Northern Illinois’ filings, maps, and grid documents reveal what’s really happening when digital infrastructure moves in.
What Growth Really Means
DeKalb’s experience offers the clearest picture. County parcel records show hundreds of millions of dollars in new equalized-assessed value (EAV) added since Meta began construction on Gurler Road [1][2]. In 2024 alone, more than $200 million was added to the rolls [2].
That growth allowed the city and park district to cut property-tax rates by roughly 20 % while still expanding services [5]. District 428 used its more substantial base to fund new early-childhood and special-education programs [6][7].
EAV growth comparison: parcels near Meta’s DeKalb campus vs. the broader county. Source: DeKalb County parcel records.
Even homes directly across from the Meta campus have seen an increase in assessed value, while 2024 tax bills fell, indicating that the project hasn’t depressed nearby property values [3][4].
A campus on the order of ~50 acres – like Batavia’s current proposal – can generate the property-tax revenue of an entire subdivision while producing only a fraction of the traffic and city-service demand [8]. When abatements expire, that value remains for decades – permanently strengthening local finances.
Enterprise-Zone transparency: DeKalb’s enterprise-zone agreements grant 20-year, 55 % property-tax abatements tied to large capital investment and local-jobs targets. Full revenues ramp up over time, but once the abatements phase out, the EAV stays on the rolls [38].
Water: Separating Facts from Fears
The biggest misconception is water use. Modern data centers rely on closed-loop and hybrid chillers that reuse the same water repeatedly, drawing only small top-offs during the hottest weather.
“These systems use ~80 % less water than older cooling towers.” – U.S. Department of Energy, 2024 [9]
Yorkville’s Project Cardinal, for example, is capped near 350,000 gpd across ~1,100 acres – roughly one-quarter the water per acre of a typical subdivision[10]. Batavia’s pending project is limited to only 1,000 gallons per day[8].
Some cities are even exploring non-potable water sources – reusing treated or reclaimed water that would otherwise be discharged – thereby eliminating nearly all impact on household supplies.
Meta, for its part, has pledged to be water-positive by 2030 – restoring more water to local watersheds than it consumes [11][12].
Quick Compare ▶ Water and Land Efficiency
Water use per acre
Typical subdivision: ~4,000–5,000 gallons per day
Modern data center: ≈ 1,000 gpd
Batavia data center: ≈ 1,000 gpd total for the Batavia project [8]
Land use for value
Typical subdivision: ≈ 500 acres per $1 billion in taxable value
Modern data center: ≈ 50 acres per $1 billion EAV
Utility solar farm: ≈ 2,000 acres per $0.25–0.3 billion in assets [28][29]
Power: How the Grid Actually Works
Northern Illinois isn’t an island; ComEd sits inside PJM’s 13-state grid stretching from Illinois to the East Coast [13]. PJM balances supply and demand every few minutes through its real-time market [14].
Adding a data center load here doesn’t destabilize the grid – it keeps jobs, the tax base, and infrastructure investment in our region, instead of somewhere else.
Large users also help finance reliable generation. Meta’s 20-year carbon-free agreement with Constellation keeps the Clinton nuclear plant operational [15], while Amazon and others have similar long-term clean energy contracts. The same nuclear facilities that serve data centers also stabilize wholesale prices for every Illinois ratepayer.
Illinois’ Clean and Reliable Grid Affordability Act now allows new nuclear development to begin in 2026 [16][17], reflecting confidence that steady baseload power complements renewables.
Even Naperville’s current proposal – still under review after public debate – shows how local oversight and state-level policy align to manage growth responsibly [18][19].
How Communities Manage Growth
Across Northern Illinois, cities are shaping development on their own terms:
DeKalb has approved some projects and denied others – including a 2025 “boutique” data center and solar proposal on Peace Road that failed twice before the City Council [37].
Batavia capped water use at 1,000 gallons per day (gpd) and oversees the project through its municipal utility [8].
Yorkville & Plano require developers to fund all road, water, and utility extensions before annexation [32].
Rochelle has hosted data centers for more than a decade under its Rate 163 tariff, using local generation to stabilize customer rates [20][21].
Aurora enacted a temporary moratorium in September 2025 to update design and noise standards [22][23].
Naperville already operates several small facilities quietly within its business parks [18][19].
Different paths, same outcome: clear expectations, transparent review, and measurable community benefit.
Farmland and Land Use
Illinois loses far more farmland to low-density residential sprawl than to any other type of development [27]. Modern data-center campuses are land-efficient – often only a few dozen acres per billion dollars of taxable value.
By comparison, solar facilities like the Burr Oak Solar Project occupy approximately 2,000 acres for a capacity of roughly 200 MW – 5 to 10 acres per MW[28][29]. Concentrating high-value, low-impact uses near existing transmission and fiber corridors helps preserve thousands of acres elsewhere for agriculture.
Transparency and Trust
Healthy skepticism makes communities stronger. Illinois’ Open Meetings and Freedom of Information Acts guarantee that local records are public [30][31]. Yorkville goes further, requiring an independent engineering review and continuous noise monitoring throughout each data center build [32][33].
Open processes like these keep the conversation anchored in verifiable facts rather than speculation.
Managing Construction and Operation
Construction brings trucks and dust – that’s why Illinois’ Construction General Permit (ILR10) and local ordinances regulate work hours, runoff, and haul routes [24].
Once operating, these facilities are tranquil. Backup generators are tested briefly each month under Illinois EPA permits that limit total runtime [25]. Landscaping, berms, and shielded lighting make them unobtrusive neighbors.
Shared Benefits and a Path Forward
Meta’s DeKalb campus alone has provided over $1 million in community grants to local schools and nonprofits [26]. Beyond those visible donations are quieter gains: modernized substations, stronger broadband routes, and more resilient municipal budgets.
Handled responsibly, data-center growth strengthens the very systems every resident relies on. Northern Illinois can either lead this balanced progress – or watch the investment migrate elsewhere. Let the data guide that choice.
Methods & Transparency
I utilize a range of AI and automation tools, in conjunction with my own research, to organize and verify complex public data – from DeKalb County tax rolls and DevNet parcel records to PJM TEAC maps and ComEd reliability filings. ChatGPT has been the primary workhorse for synthesis, but I also utilize Copilot, Gemini, Claude, and Grok to cross-check facts, refine tone, and develop Python-based tools for analysis. Grammarly keeps the writing clear – I use it for nearly everything I write, even texts.
Over the past several months, I’ve invested well over 100 hours reviewing, verifying, and refining this information. I have also permanently archived more than 100 key source documents in the Internet Archive’s Wayback Machine to ensure transparency and durability. The work is still ongoing as new filings and community feedback come in.
Every figure and citation is sourced from public records that you can verify independently. My goal is to make complex infrastructure and taxation topics accessible and understandable to everyone in the community. I’m just a local guy with a day job and a family, trying to make the public data we already have a little easier for everyone to understand.
If you’d like a deeper, fully-sourced explanation of why electric bills rose statewide, how PJM Interconnection pricing actually works, and what role data centers do and don’t play in local rates, see: Why Electric Bills Really Rose, and What It Means for Data Centers