Mike Hammett

How things actually work.

Tag: Meta

  • An Open Letter to Data Center Developers: Transparency Prevents Delays

    An Open Letter to Data Center Developers: Transparency Prevents Delays

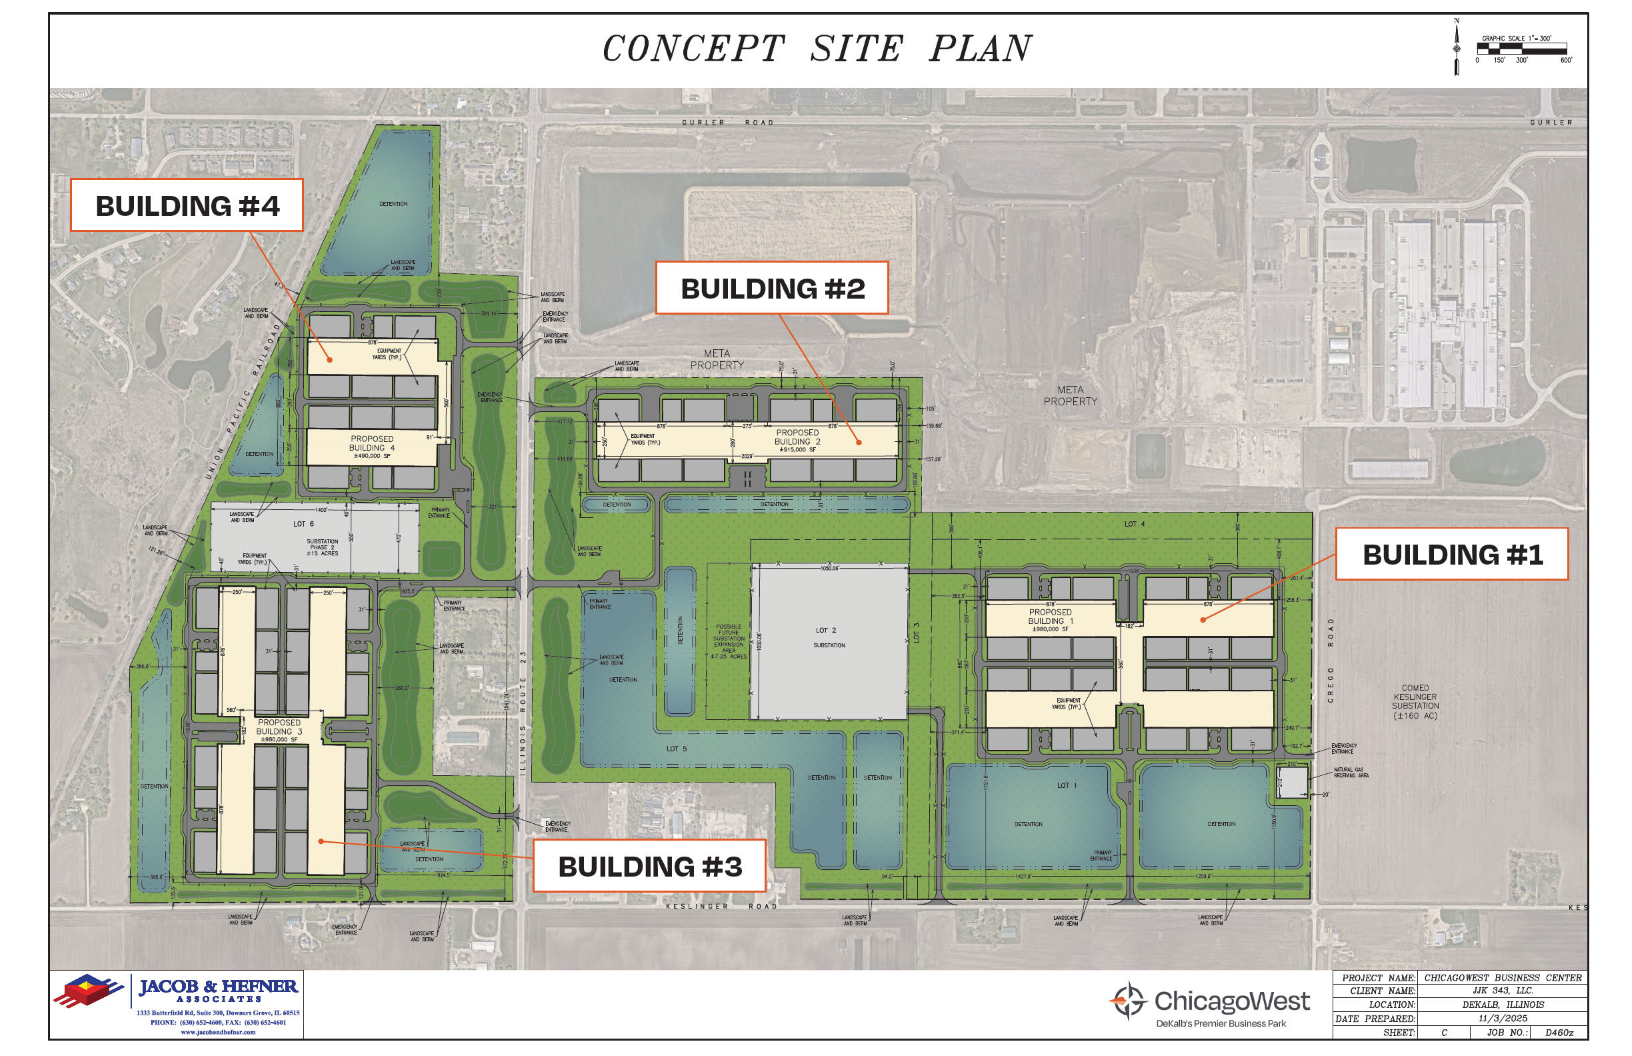
    Edged's proposed Project Vector concept site plan – December 1, 2025 DeKalb PZC Agenda Packet
    Concept site plan for Edged’s proposed Project Vector, ChicagoWest Business Center, DeKalb, IL. Source: December 1, 2025 Planning and Zoning Commission Agenda Packet.

    AI tools were used in the research, drafting, and editing of this article. All factual claims are sourced to primary documents and verified by the author.

    How small changes in transparency can prevent delays, diffuse misinformation, and improve community acceptance.


    As someone who works adjacent to the data center world – in telecom, fiber, and the broader infrastructure ecosystem – I’ve spent the last few months filling the information vacuum around new data center proposals. Not because I’m in the industry, and not because I attend public meetings (I don’t), but because residents reach out online when they can’t get clear answers from the people actually building these facilities. When a telecom guy becomes the de facto explainer of your projects, it’s a sign that something in your communication approach isn’t matching the scale and impact of the developments themselves.

    I’m pro-infrastructure. I want these facilities built. But supporting data centers doesn’t mean overlooking avoidable communication gaps that make your projects harder than they need to be. Consider this tough love – firm because it matters, fair because it’s warranted, and offered because too many good projects are getting delayed or blocked over misunderstandings that never should have taken root.


    The Information Vacuum

    Most people in any given community are indifferent or quietly supportive of data center development. But when information is sparse, the loudest voices – sometimes just a handful of people – end up defining the narrative. In the absence of clear, early communication from you, residents fill the gaps with whatever they’ve recently read or watched: crypto mines in Tennessee, water disputes in Oregon, diesel controversies in Ireland, AI hype cycles in California, surveillance conspiracies, or grid-collapse speculation that doesn’t apply to PJM territory at all.

    These examples aren’t representative of most cloud-style facilities, especially in northern climates, but the public has no way to know that unless you say so. When you wait until the zoning hearing to speak, you’re not guiding the conversation – you’re trying to unwind months of assumptions.


    What Communities Need – and What They’re Not Getting

    Communities don’t need customer lists or workload diagrams. They understand confidentiality, NDAs, and the operational reality that workloads evolve over time. Customer mixes change, hardware refreshes shift cooling profiles, and what runs in year one may not match what runs in year five. Nobody expects you to freeze your statements in place.

    But residents do need basic categorical clarity – enough to distinguish a standard cloud facility from the worst-case examples they’ve heard about. You can safely say:

    • “This is standard cloud compute.”
    • “This is not cryptocurrency mining.”
    • “This is not a large AI training cluster.”
    • “This supports everyday business and consumer applications.”

    These are broad, durable statements. They don’t violate confidentiality. They simply prevent people from assuming that your project is whatever alarming headline they saw last.

    Without even this level of clarity, the imagination fills the vacuum – and rarely in your favor.


    The Security Inertia Problem

    One of the most common complaints I see is what looks like “Fort Knox around a pond.” Site plans often show vast fenced areas protecting empty land, detention basins, or prairie restoration zones far from the operational building. Residents see this and assume something secretive or hazardous is being hidden.

    In reality, this is usually design-by-inertia: security measures intended for the building quietly expand outward until they cover land with no operational sensitivity at all. Nobody is trying to compromise national security by accessing your stormwater pond.

    Secure the building, loading docks, electrical rooms, and gensets – absolutely. But fencing off dozens or hundreds of benign acres eliminates opportunities to offer genuine community benefit. Those areas could support mixed-use trails, green space, pollinator habitats, agricultural co-use, fishing ponds, or solar co-siting. Instead, they often become unused no-go zones that reinforce the “secret compound” narrative.

    This is one of the easiest, lowest-cost opportunities to build goodwill – and it’s consistently overlooked.


    The Jobs Story You’re Not Telling

    When you say “30 permanent jobs,” residents often assume that’s the entire economic impact. It’s not – not even close.

    Direct operational jobs are fewer in number but highly technical: critical-facilities technicians, electrical and mechanical specialists, network engineers, security staff, logistics personnel, and site managers. These roles are well-paid, high-skill, and persist for the life of the facility.

    Contractors and construction-phase trades represent the largest share of total employment during the build-out years. Large data center campuses are constructed in phases over nearly a decade, creating recurring waves of work for electricians, pipefitters, welders, plumbers, masons, steel crews, carpenters, crane operators, heavy-equipment operators, HVAC specialists, low-voltage integrators, fiber crews, concrete teams, and many more. These are long, rolling cycles of employment – not short bursts. As Daniel Golding pointed out in a widely read post, many tradespeople deliberately seek out data center work because it’s stable, complex, and long-term.

    Ongoing trades work continues after the initial build-out. Facilities still require contractors for electrical modifications, fiber expansions, new circuits, equipment swaps, mechanical upgrades, plumbing work, generator service, cooling adjustments, preventive maintenance, and periodic retrofits. The headcount is smaller than during peak construction, but it never drops to zero.

    And the ripple effects matter, too: full hotels, busy restaurants, steady supplier activity, equipment rentals, constant logistics runs, and improved peering/backhaul opportunities for local ISPs.

    If you don’t tell this story, people assume a billion-dollar project creates “30 jobs,” and nothing more – a wildly incomplete picture.


    Why Operators Must Show Up

    Developers often take the heat for decisions they neither make nor control. They get grilled about workloads, cooling strategies, water profiles, power curves, expansion phases, and operational philosophy. But developers don’t own those decisions – operators do.

    When operators remain silent due to internal policies or broad NDAs, the developer becomes the face of secrecy. That’s unfair to the developer and unhelpful to the project. To build trust, operators need to participate directly in communication – even briefly – so that answers come from the people who actually know them.

    And let’s be honest – this isn’t the Manhattan Project. People move between data center companies all the time. Even if they’re not sharing proprietary documents, the expertise they gained follows them. The things you’re holding back from communities aren’t meaningful competitive secrets. Over-classification doesn’t keep competitors in the dark; it only keeps residents in the dark – and they’re the ones with the power to delay or block your project.


    The Role of Utilities and Media

    Utilities need to speak plainly. Electric providers should explain load forecasting, substation upgrades, and reliability planning. Water agencies should clarify regional aquifer behavior and seasonal pump profiles. Fiber builders should explain what they’re installing and whether it benefits the community. Natural gas providers should confirm whether anything has changed (often: nothing).

    Journalists are part of this dynamic too. Infrastructure is complex, and newsrooms are stretched thin. Reporters aren’t given months to master hybrid cooling systems, grid-planning frameworks, water science, or enterprise architecture. A constructive suggestion: infrastructure reporters should maintain a small bench of trusted technical advisors – the same way health reporters rely on physicians or finance reporters rely on analysts. Advisors don’t tell them what to write; they help ensure the technical context is accurate. Your transparency makes that possible.


    Iteration Beats Silence

    No one expects perfection the first time. Communication – like software, cooling systems, and operational tooling – improves through iteration. If something doesn’t land, revise it. If a message confuses instead of clarifies, refine it. Communities forgive imperfection when they see honest effort. Silence and defensiveness are what they won’t forgive.

    Not everyone is persuadable, but most people are. The goal isn’t to win over the immovable few; it’s to ensure silence doesn’t let them speak for everyone else.


    If I’m Wrong About Anything, You Just Proved the Point

    I work closer to this ecosystem than most residents ever will. I read zoning packets, utility filings, engineering documents, and planning memos – and even I still have to infer many details because they aren’t publicly explained. If someone like me can’t get a clear picture, residents have no chance.

    If I misunderstood anything here, it shouldn’t be taken as bias or malice. It should be seen for what it is: evidence that essential information isn’t being communicated.

    You’re building critical infrastructure. Communities deserve to understand it. And you deserve smoother, more predictable, less adversarial project approvals. Those goals aren’t in conflict – but achieving them requires speaking earlier, more clearly, and more consistently, before someone else fills the silence for you.

    Mike Hammett, Author, Data Center Myth-Busting Series

    Methods & Transparency

    I utilize a range of AI and automation tools, in conjunction with my own research, to organize and verify complex public data – from DeKalb County tax rolls and DevNet parcel records to PJM TEAC maps and ComEd reliability filings. ChatGPT has been the primary workhorse for synthesis, but I also utilize Copilot, Gemini, Claude, and Grok to cross-check facts, refine tone, and develop Python-based tools for analysis. Grammarly keeps the writing clear – I use it for nearly everything I write, even texts.

    Over the past several months, I’ve invested well over 100 hours reviewing, verifying, and refining this information. I have also permanently archived more than 100 key source documents in the Internet Archive’s Wayback Machine to ensure transparency and durability. The work is still ongoing as new filings and community feedback come in.

    Every figure and citation is sourced from public records that you can verify independently. My goal is to make complex infrastructure and taxation topics accessible and understandable to everyone in the community. I’m just a local guy with a day job and a family, trying to make the public data we already have a little easier for everyone to understand.


    This article is part of the Data Centers: The Public Record series. View all open letters →
  • How Meta’s Data Center Affected DeKalb County Property Taxes (2020–2024)

    How Meta’s Data Center Affected DeKalb County Property Taxes (2020–2024)

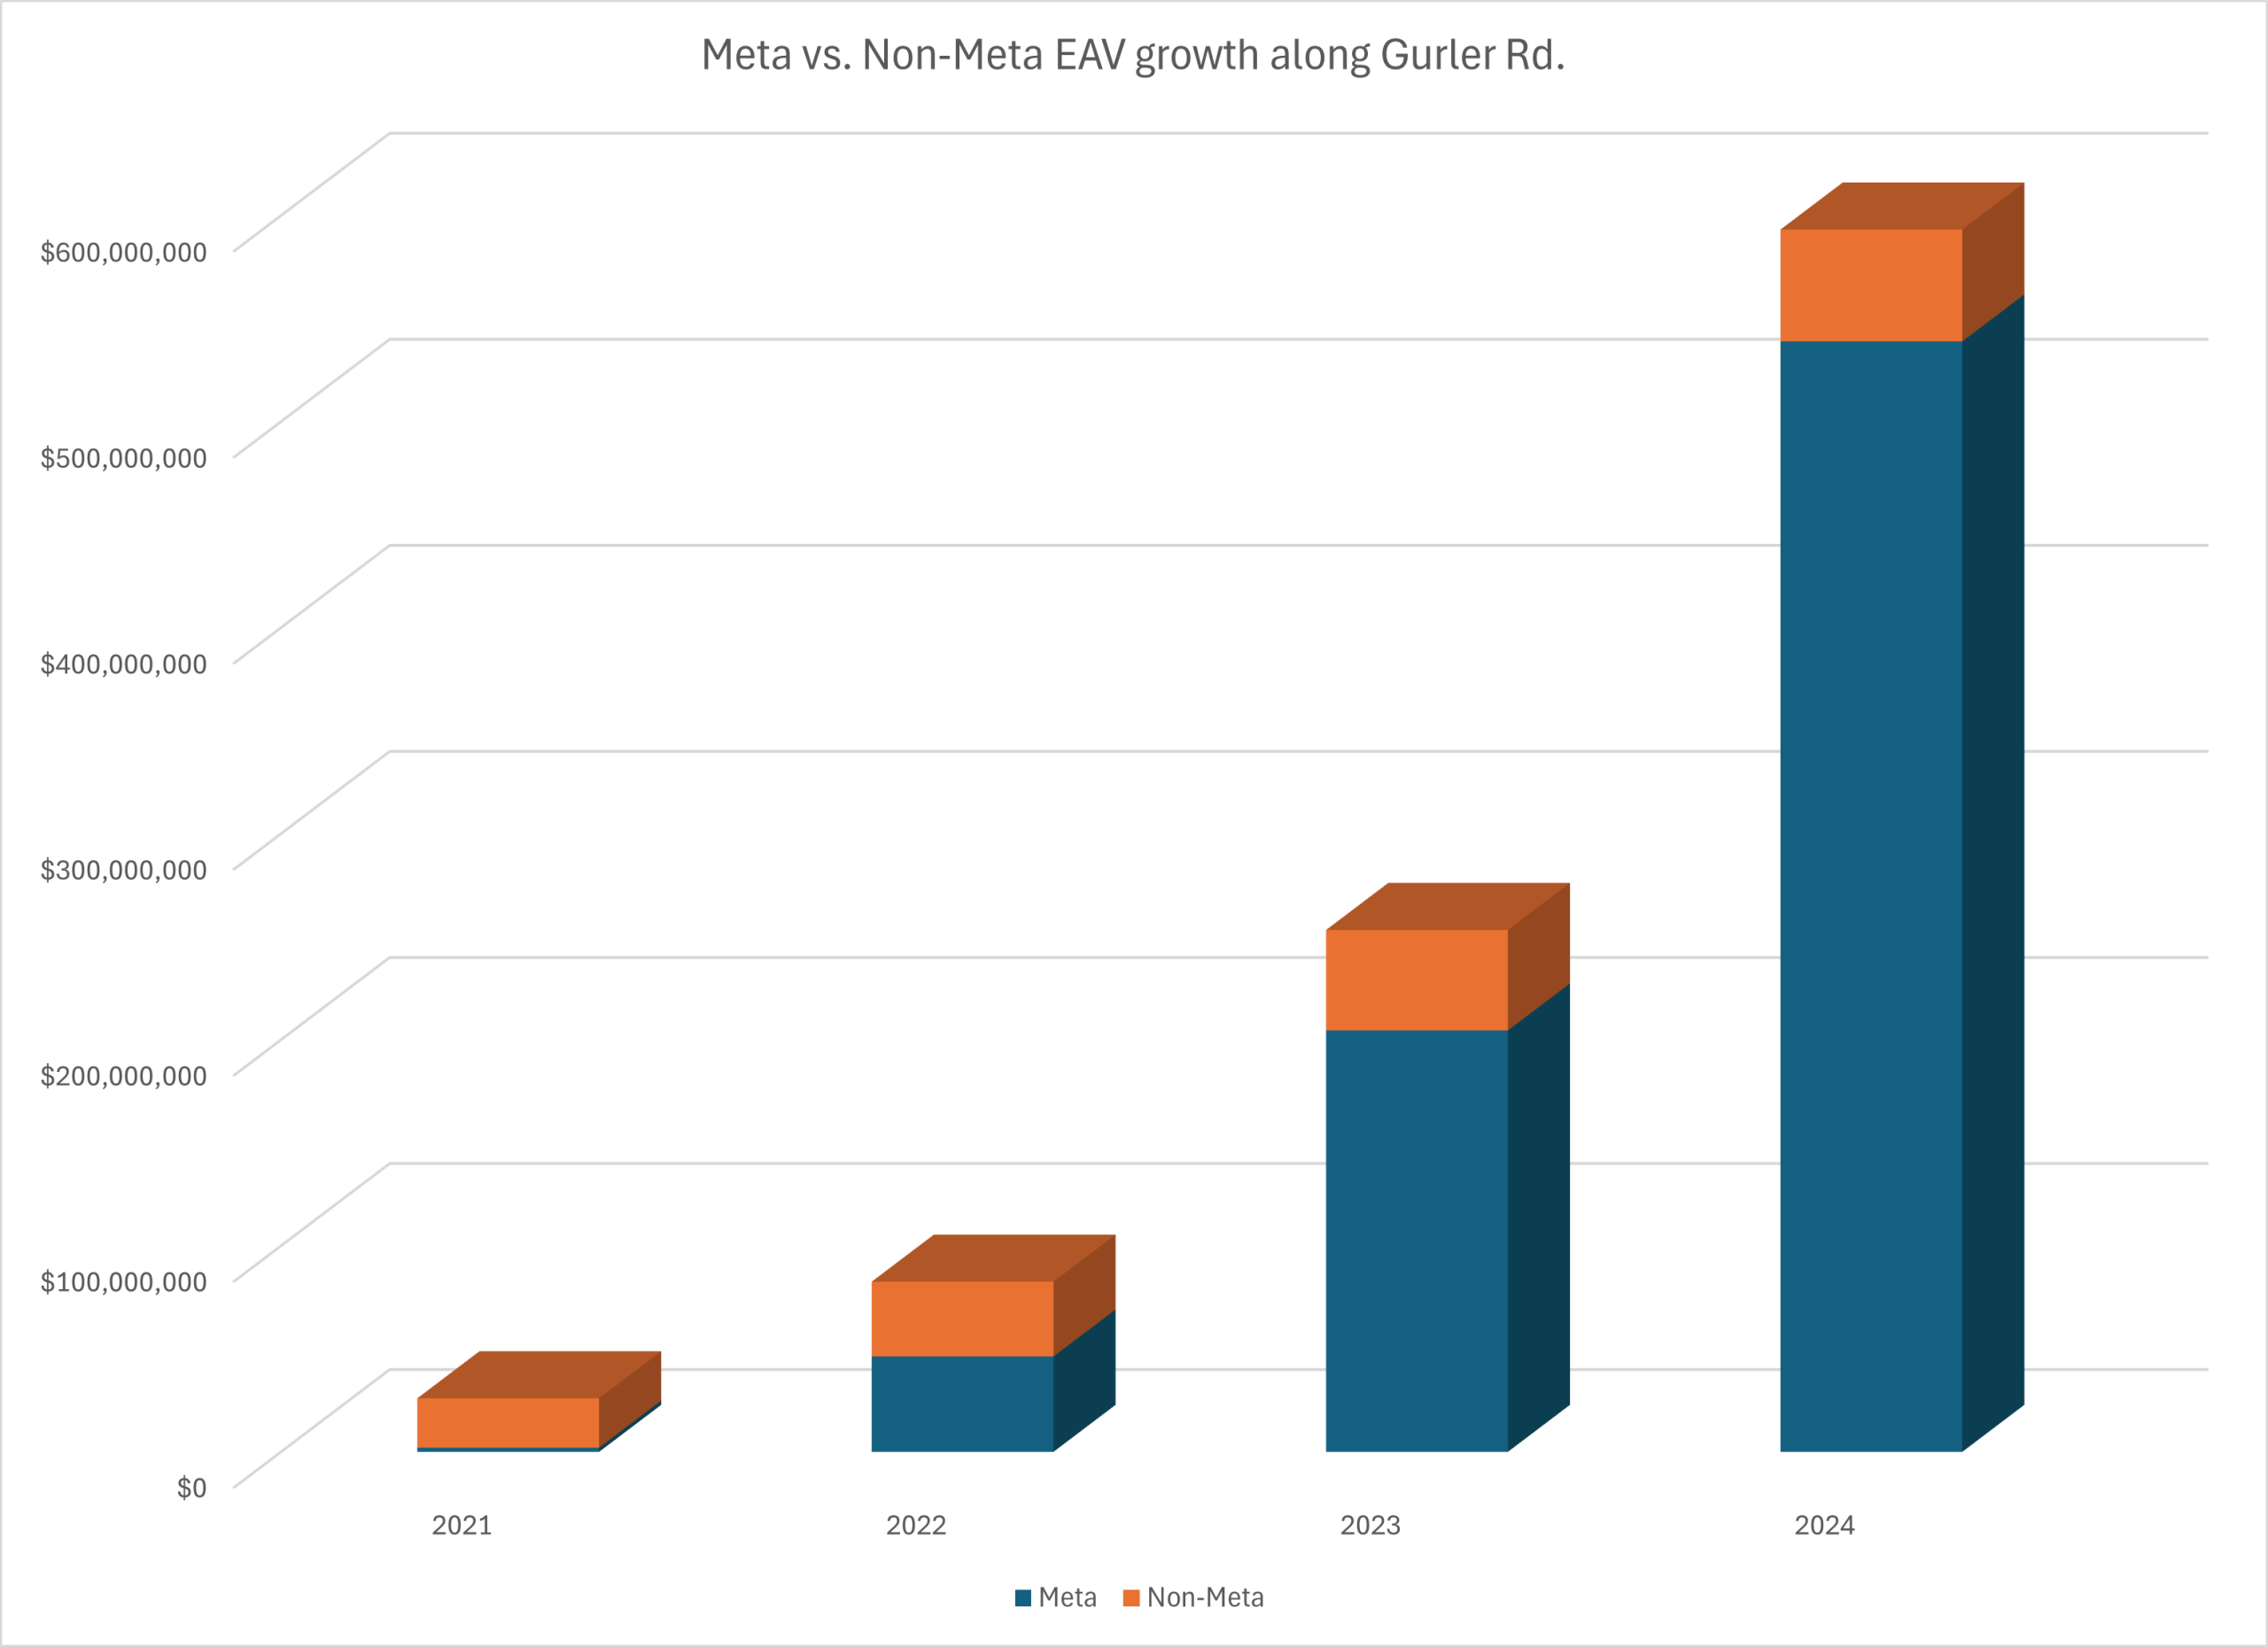
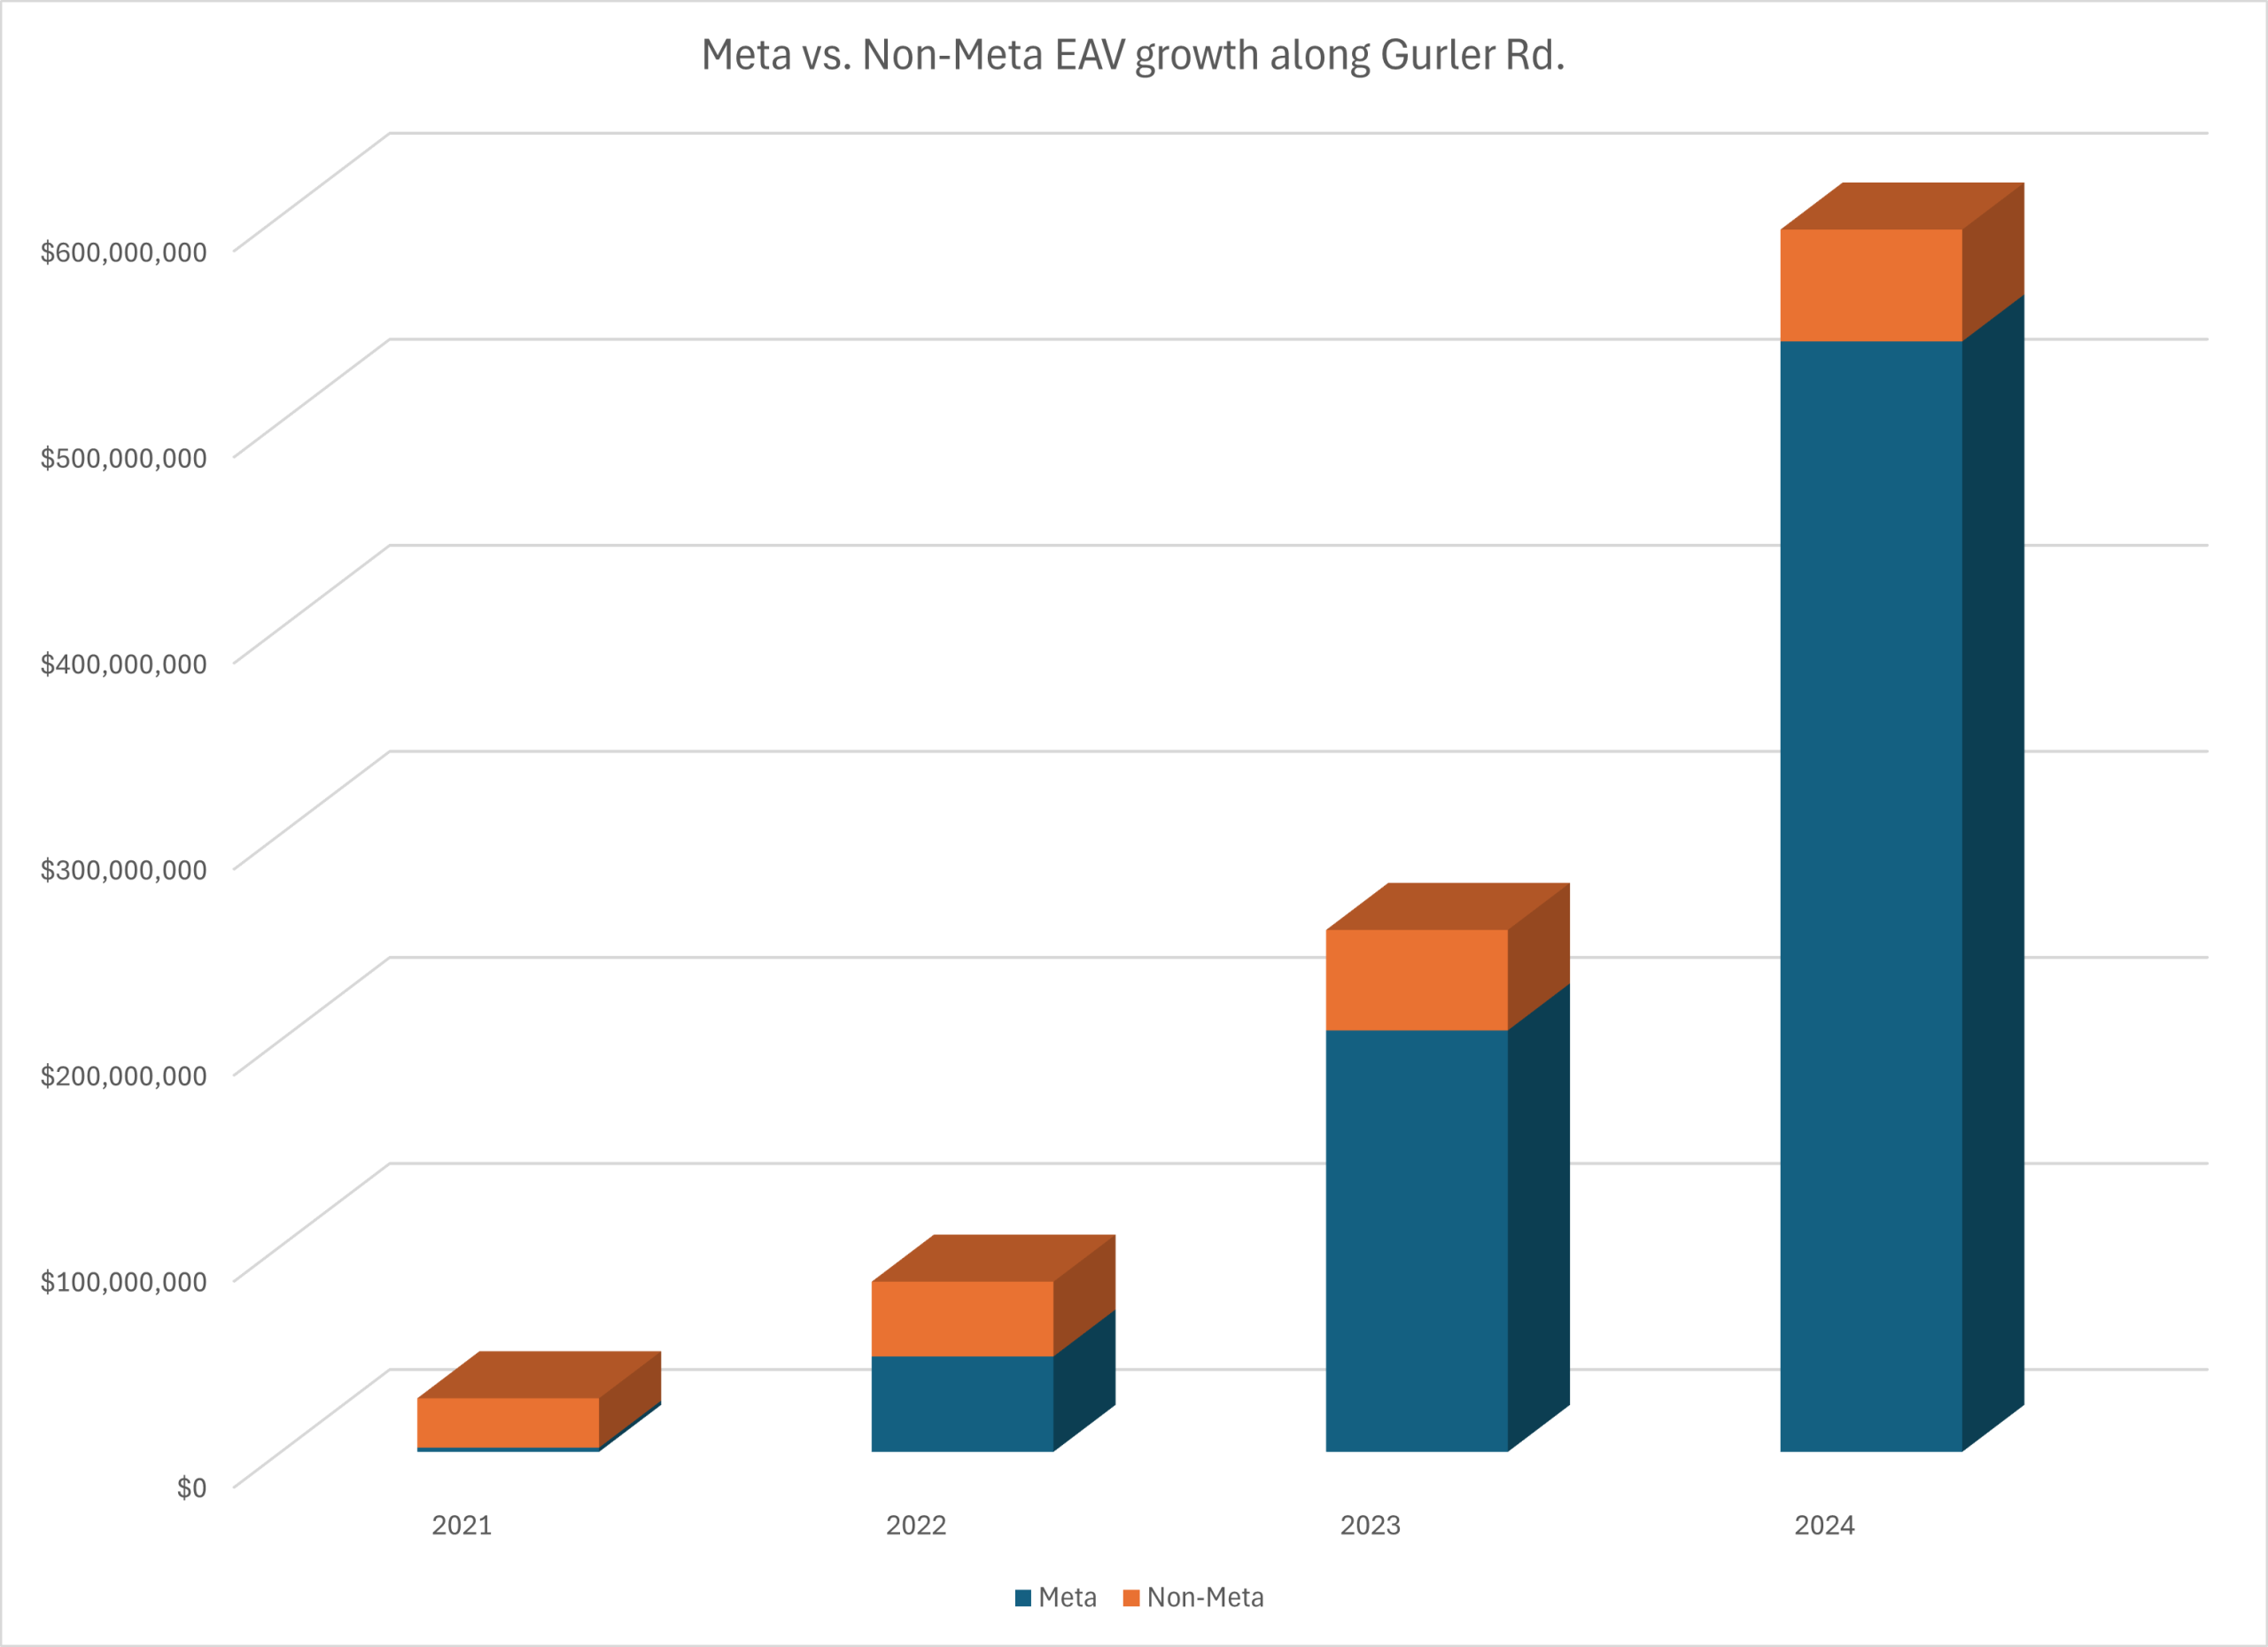
    Bar chart comparing Meta vs. Non-Meta Equalized Assessed Value growth along Gurler Road, DeKalb County, Illinois, 2021-2024
    Meta vs. Non-Meta EAV growth along Gurler Road, DeKalb County, 2021–2024. Source: DeKalb County assessment records.

    AI tools were used in the research, drafting, and editing of this article. All factual claims are sourced to primary documents and verified by the author.

    Residents in DeKalb and Sycamore have had understandable questions about how Meta’s data center and other recent developments affect property values, tax bills, and local budgets. With assessments rising and different taxing bodies making different levy decisions, it can be hard to make sense of what’s happening. This addendum consolidates actual county tax bills, public levy notices, parcel-level data, and Enterprise Zone documents to provide a clear explanation of what occurred between 2020 and 2024.

    This article is part of the broader series “What Data Centers Actually Mean for Northern Illinois Communities”.It focuses specifically on property taxes – giving residents, officials, and skeptical readers a complete, source-rich breakdown of this topic without having to sift through the whole overview piece.


    1. How Illinois Property Taxes Really Work

    Illinois uses a levy-based property tax system.[68] Each taxing body – school district, city, park district, township, library, or county – decides how many dollars it needs for the year. The tax rate is then determined automatically:

    Rate = Levy ÷ Equalized Assessed Value (EAV).[68][69]

    Your tax bill depends not only on your home’s EAV but also on the total EAV of the whole taxing district. When the tax base grows, the same levy can be shared across more value, which lowers the rate and reduces the burden for each resident.[70, “How Rates Are Set”]

    This is why large commercial and industrial projects can meaningfully shift the tax load.


    2. What an Enterprise Zone Abatement Actually Is

    An Enterprise Zone abatement does not refund taxes and does not give money back to a company. It temporarily discounts only a portion of the new value created by the improvement through new construction.[74, “Property Tax Abatement”][75, Subpart J §§520.1000–1030]

    Land and pre-existing improvements remain fully taxed. Only a portion of the new value is abated for a fixed period.

    A simple way to think about it: Collecting 50% of something is better than collecting 100% of nothing.

    Without the project, that new value – and its revenue – would not exist. With it, communities receive millions in new dollars even during the abatement period.[70, FAQ #4]


    3. Meta’s Actual Taxes Paid in 2024

    Three Meta parcels were fully on the 2024 tax rolls:

    Parcel 11-01-100-004 • EAV: $531,240,341 • Total tax: $31,458,804.32[71]

    Parcel 11-02-200-004 • EAV: $7,362,771 • Total tax: $587,162.06[72]

    Parcel 11-01-100-005 • EAV: $333,896 • Total tax: $26,627.36[73]

    Total paid by Meta in 2024: $32,072,593.74

    Approximately $19.43 million went to School District 428 (derived from taxing-body splits in [71][73]). Another $12.64 million was allocated to the City, County, Park District, Library, Township, Kishwaukee College, and other entities.

    These are actual numbers already reflected in local budgets.


    4. Meta’s Abatement in Context

    The 2024 Enterprise Zone report confirms: • 55% abatement on new improvements • 20-year schedule beginning with 2024 taxes[76, p. 2]

    The abated amount on the main parcel’s new improvement value in 2024 was approximately $10.9 million. Without abatement, the total potential would have been roughly $42 million across the phased schedule.[76, p. 3]

    Yet, Meta still paid approximately $31.5 million for the main parcel in 2024.

    Even with abatement, Meta is one of the largest taxpayers in northern Illinois.


    5. DeKalb vs. Sycamore: What Actually Happened to Homeowners (2020–2024)

    Nearly all parcels saw EAV increases due to market conditions:[82] • DeKalb: 97.9% of parcels increased • Sycamore: 97.3% of parcels increased

    But tax bills diverged sharply:

    Parcels where total tax decreased: • DeKalb: 81.5% • Sycamore: 11.2%

    Detailed movement (EAV ↑/↓ vs Bill ↑/↓), using 2020–2024 parcel-level data:[82]

    DeKalb • EAV↑ & Tax↓: 7,813 parcels (73.2%) • EAV↑ & Tax↑: 1,820 parcels (17.0%) • EAV↓ & Tax↓: 93 parcels • EAV↓ & Tax↑: 1 parcel

    Sycamore • EAV↑ & Tax↓: 803 parcels (10.1%) • EAV↑ & Tax↑: 6,375 parcels (79.9%) • EAV↓ & Tax↓: 45 parcels • EAV↓ & Tax↑: 0 parcels

    The difference is largely due to DeKalb’s rapidly expanding commercial/industrial tax base – Meta, Ferrara, Amazon, and others in District 428 – versus Sycamore’s comparatively slow growth.[82]

    Bar chart comparing Meta vs. Non-Meta Equalized Assessed Value growth along Gurler Road, DeKalb County, Illinois, 2021-2024
    Meta vs. Non-Meta EAV growth along Gurler Road, DeKalb County, 2021–2024. Source: DeKalb County assessment records.

    6. The City of DeKalb’s Proposed Levy Increase

    Official City notice for 2025 shows:[77]

    • Levy increase: 7.65% • EAV increase: 7.65% • Tax rate: 0.62286 → 0.62284 (essentially flat)

    When levy and EAV rise together, the rate stays stable. New commercial/industrial EAV absorbs the increase.


    7. The Park District’s 2025 Proposal and Long-Term Trend

    Park District’s 2025 notice:[78]

    • Levy increase: 8.03% • Rate increase: 0.49147 → 0.55090 (~12.1%)

    Their example shows the Park District line on a ~$300k home rising from ~$511 to ~$633.

    However, context matters: From 2019 to 2024, the Park District tax rate decreased by 32%, from 0.72045% to 0.49147%, as the EAV more than doubled.[79]

    Even with the proposed 2025 increase, the rate remains 23% lower than in 2019.


    8. Why Some Individual Bills Still Rose

    Even when a district experiences a strong rate compression overall, individual bills may rise when:

    • A particular home’s EAV increases faster than average • Improvements were added • Exemptions changed • Smaller taxing bodies increased levies faster than their EAV rose[70, “Why Bills Vary”]

    These are individual circumstances – not contradictions of the multi-year pattern.


    9. What This Addendum Does Not Claim

    This addendum does not claim: • that taxes never rise • that abatements have no cost • that large taxpayers eliminate levy increases • that every homeowner saw the same outcome

    It reports on what occurred from 2020 to 2024, using actual tax bills and official documents.


    10. A Call to Action

    Residents can request that their taxing bodies provide clearer levy/EAV explanations, side-by-side comparisons, and plain-language breakdowns of how new construction affects tax rates.

    Taxing bodies can improve transparency by providing simple levy/EAV charts and clean explanations of each line item.


    11. Closing Thoughts

    Between 2020 and 2024, DeKalb added hundreds of millions of dollars of new commercial and industrial EAV.[82]

    Meta alone contributed more than $32 million in taxes in 2024.[71–73]

    This expanded base allowed District 428 and others to maintain necessary revenue while lowering tax rates, resulting in most DeKalb homeowners seeing lower tax bills even as assessments rose.

    Sycamore, without similar development, experienced the opposite trend.[82]

    The multi-year pattern is clear: When more value shares the load, homeowners benefit.

    Methods & Transparency

    I utilize a range of AI and automation tools, in conjunction with my own research, to organize and verify complex public data – from DeKalb County tax rolls and DevNet parcel records to PJM TEAC maps and ComEd reliability filings. ChatGPT has been the primary workhorse for synthesis, but I also utilize Copilot, Gemini, Claude, and Grok to cross-check facts, refine tone, and develop Python-based tools for analysis. Grammarly keeps the writing clear – I use it for nearly everything I write, even texts.

    Over the past several months, I’ve invested well over 100 hours reviewing, verifying, and refining this information. I have also permanently archived more than 100 key source documents in the Internet Archive’s Wayback Machine to ensure transparency and durability. The work is still ongoing as new filings and community feedback come in.

    Every figure and citation is sourced from public records that you can verify independently. My goal is to make complex infrastructure and taxation topics accessible and understandable to everyone in the community. I’m just a local guy with a day job and a family, trying to make the public data we already have a little easier for everyone to understand.

    This article is part of the Data Centers: The Public Record series. View all technical analysis →


    [68] Illinois Department of Revenue – PTAX-60 Property Tax Rate and Levy Manual https://web.archive.org/web/20250728002219/https://tax.illinois.gov/content/dam/soi/en/web/tax/research/publications/documents/localgovernment/ptax-60.pdf

    [69] 35 ILCS 200 – Property Tax Code (Art. 18, §18-50) https://web.archive.org/web/20251115214636/https://www.ilga.gov/Legislation/ILCS/Articles?ActID=593&ChapterID=8&SeqStart=6700000&SeqEnd=8000000

    [70] DeKalb County Finance Office – Property Tax Levies & Rates (“How Rates Are Set,” “Why Bills Vary,” FAQ #4) https://web.archive.org/web/20240723184239/https://dekalbcounty.org/departments/finance-office/financial-tax-information/property-tax-levies-rates/

    [71] DevNet – Parcel 11-01-100-004 (2024 Tax Bill) https://web.archive.org/web/20251115143744/https://dekalbil.devnetwedge.com/parcel/view/1101100004/2024

    [72] DevNet – Parcel 11-02-200-004 (2024 Tax Bill) https://web.archive.org/web/20251115143737/https://dekalbil.devnetwedge.com/parcel/view/1102200004/2024

    [73] DevNet – Parcel 11-01-100-005 (2024 Tax Bill) https://web.archive.org/web/20251115144001/https://dekalbil.devnetwedge.com/parcel/view/1101100005/2024

    [74] Illinois DCEO – Enterprise Zone Program (“Property Tax Abatement”) https://web.archive.org/web/20251115210754/https://dceo.illinois.gov/expandrelocate/incentives/taxassistance/enterprisezone.html

    [75] 14 Ill. Adm. Code Part 520 – Enterprise Zone Rules (Subpart J §§520.1000–1030) https://web.archive.org/web/20251115210753/https://www.ilga.gov/agencies/JCAR/EntirePart?titlepart=01400520

    [76] DeKalb County – Enterprise Zone Abatement Report, Tax Year 2024 https://web.archive.org/web/20251115144040/https://dekalbcounty.org/wp-content/uploads/2025/05/tr-ez-abatement24-25.pdf

    [77] City of DeKalb – 2025 Proposed Property Tax Levy Increase Notice https://web.archive.org/web/20251115211405/https://www.cityofdekalb.com/DocumentCenter/View/19994/9-2025-BBN-Pub-110125

    [78] DeKalb Park District – Truth in Taxation 2025 https://web.archive.org/web/20251115210919/https://dekalbparkdistrict.com/news/truth-in-taxation-2025

    [79] DeKalb Park District – Tax Levy & EAV Historical Summary (2019–2024) https://web.archive.org/web/20251102171237/https://dekalbparkdistrict.community.highbond.com/document/13a4a189-cf56-4454-938f-ba9ef5a28ade/

    [80] Supervisor of Assessments – Annual Report 2022 (p. 7: abatement applies only to new construction) https://web.archive.org/web/20240714172127/https://dekalbcounty.org/wp-content/uploads/2023/05/ao-annrpt-2022.pdf

    [81] DevNet public lookup landing page https://web.archive.org/web/20251115212527/https://dekalbcounty.org/departments/treasurer-collector/

    [82] DeKalb County Treasurer – parcel-level EAV/tax datasets for 2020–2024 (via data request; public lookup at dekalbil.devnetwedge.com) https://web.archive.org/web/20251115212527/https://dekalbcounty.org/departments/treasurer-collector/

  • What Data Centers Actually Mean for Northern Illinois Communities

    What Data Centers Actually Mean for Northern Illinois Communities

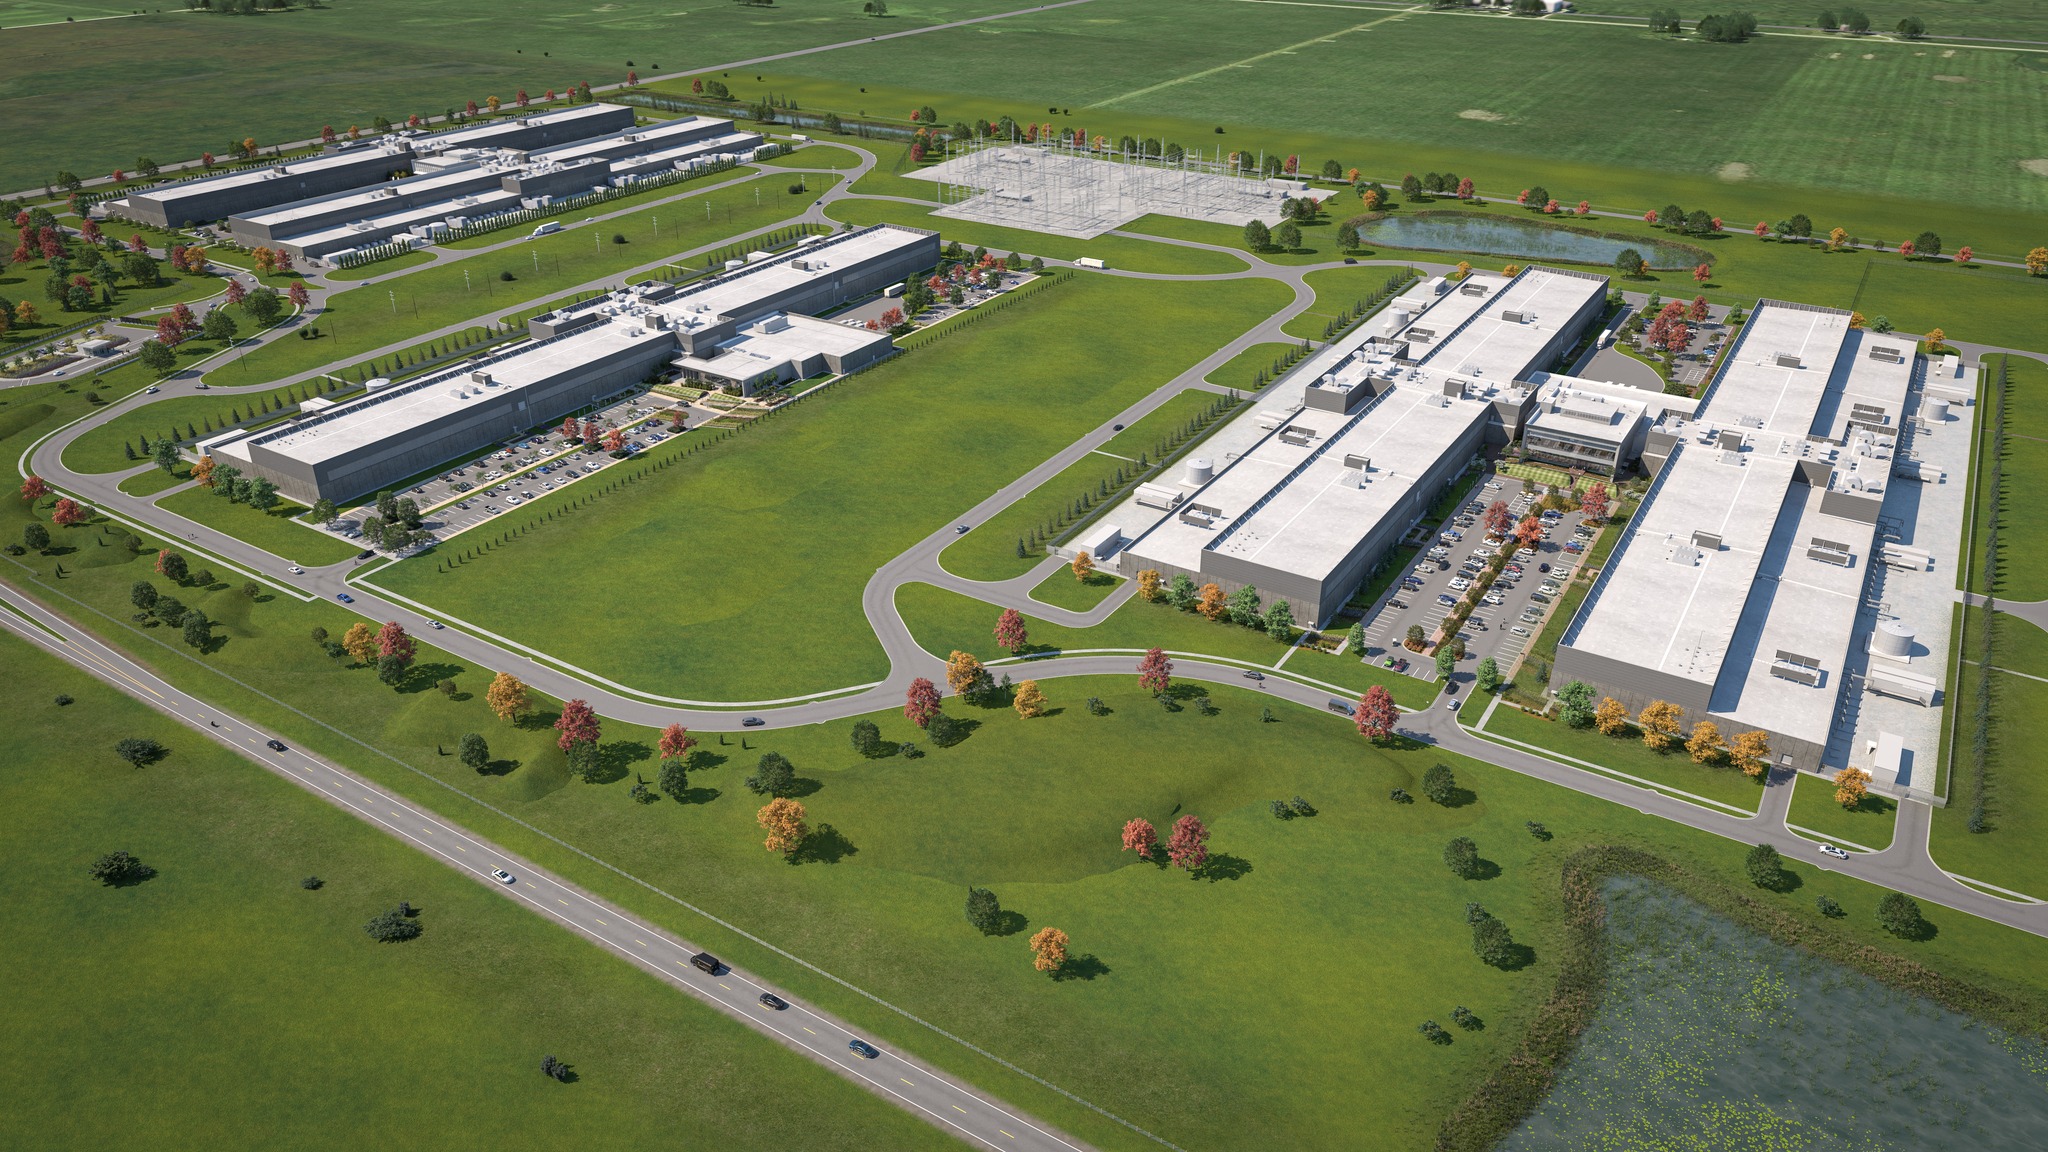
    Aerial rendering of Meta's DeKalb, Illinois data center campus showing multiple large server buildings, parking areas, and surrounding green space
    Meta’s DeKalb, Illinois data center campus. Source: Meta.

    AI tools were used in the research, drafting, and editing of this article. All factual claims are sourced to primary documents and verified by the author.


    A fact-checked look at taxes, water, power, and local control


    TL;DR: Data-center projects along I-88 have added hundreds of millions in new taxable value – about $200 million in 2024 alone – helping local governments cut tax rates around 20 % while expanding services. Modern campuses use hybrid cooling that cuts water use ~80 %, and Illinois’ grid – increasingly powered by nuclear and renewables – keeps them largely carbon-free. Every project operates under local water caps, noise rules, and open-record laws that ensure community control.

    The more technical deep dives on electricity and property taxes are linked below.


    A Region in Transition

    Cornfields along I-88 have rapidly transformed into billion-dollar data-center campuses. That pace of change has sparked valid questions: Will they drain our water? Overload the grid? Take over farmland or raise taxes?

    Those are fair questions – and the public record already has the answers. Northern Illinois’ filings, maps, and grid documents reveal what’s really happening when digital infrastructure moves in.


    What Growth Really Means

    DeKalb’s experience offers the clearest picture. County parcel records show hundreds of millions of dollars in new equalized-assessed value (EAV) added since Meta began construction on Gurler Road [1][2]. In 2024 alone, more than $200 million was added to the rolls [2].

    That growth allowed the city and park district to cut property-tax rates by roughly 20 % while still expanding services [5]. District 428 used its more substantial base to fund new early-childhood and special-education programs [6][7].

    Bar chart comparing EAV growth in Meta-adjacent parcels versus non-Meta parcels in DeKalb County, 2020-2024
    EAV growth comparison: parcels near Meta’s DeKalb campus vs. the broader county. Source: DeKalb County parcel records.

    Even homes directly across from the Meta campus have seen an increase in assessed value, while 2024 tax bills fell, indicating that the project hasn’t depressed nearby property values [3][4].

    A campus on the order of ~50 acres – like Batavia’s current proposal – can generate the property-tax revenue of an entire subdivision while producing only a fraction of the traffic and city-service demand [8]. When abatements expire, that value remains for decades – permanently strengthening local finances.

    Enterprise-Zone transparency: DeKalb’s enterprise-zone agreements grant 20-year, 55 % property-tax abatements tied to large capital investment and local-jobs targets. Full revenues ramp up over time, but once the abatements phase out, the EAV stays on the rolls [38].


    Water: Separating Facts from Fears

    The biggest misconception is water use. Modern data centers rely on closed-loop and hybrid chillers that reuse the same water repeatedly, drawing only small top-offs during the hottest weather.

    “These systems use ~80 % less water than older cooling towers.” – U.S. Department of Energy, 2024 [9]

    Yorkville’s Project Cardinal, for example, is capped near 350,000 gpd across ~1,100 acres – roughly one-quarter the water per acre of a typical subdivision [10]. Batavia’s pending project is limited to only 1,000 gallons per day [8].

    Some cities are even exploring non-potable water sources  – reusing treated or reclaimed water that would otherwise be discharged – thereby eliminating nearly all impact on household supplies.

    Meta, for its part, has pledged to be water-positive by 2030 – restoring more water to local watersheds than it consumes [11][12].


    Quick Compare ▶ Water and Land Efficiency

    Water use per acre

    • Typical subdivision: ~4,000–5,000 gallons per day
    • Modern data center: ≈ 1,000 gpd
    • Bataviadata center: ≈ 1,000 gpd total for the Batavia project [8]

    Land use for value

    • Typical subdivision: ≈ 500 acres per $1 billion in taxable value
    • Modern data center: ≈ 50 acres per $1 billion EAV
    • Utility solar farm: ≈ 2,000 acres per $0.25–0.3 billion in assets [28][29]

    Power: How the Grid Actually Works

    Northern Illinois isn’t an island; ComEd sits inside PJM’s 13-state grid stretching from Illinois to the East Coast [13]. PJM balances supply and demand every few minutes through its real-time market [14].

    Adding a data center load here doesn’t destabilize the grid – it keeps jobs, the tax base, and infrastructure investment in our region, instead of somewhere else.

    Large users also help finance reliable generation. Meta’s 20-year carbon-free agreement with Constellation keeps the Clinton nuclear plant operational [15], while Amazon and others have similar long-term clean energy contracts. The same nuclear facilities that serve data centers also stabilize wholesale prices for every Illinois ratepayer.

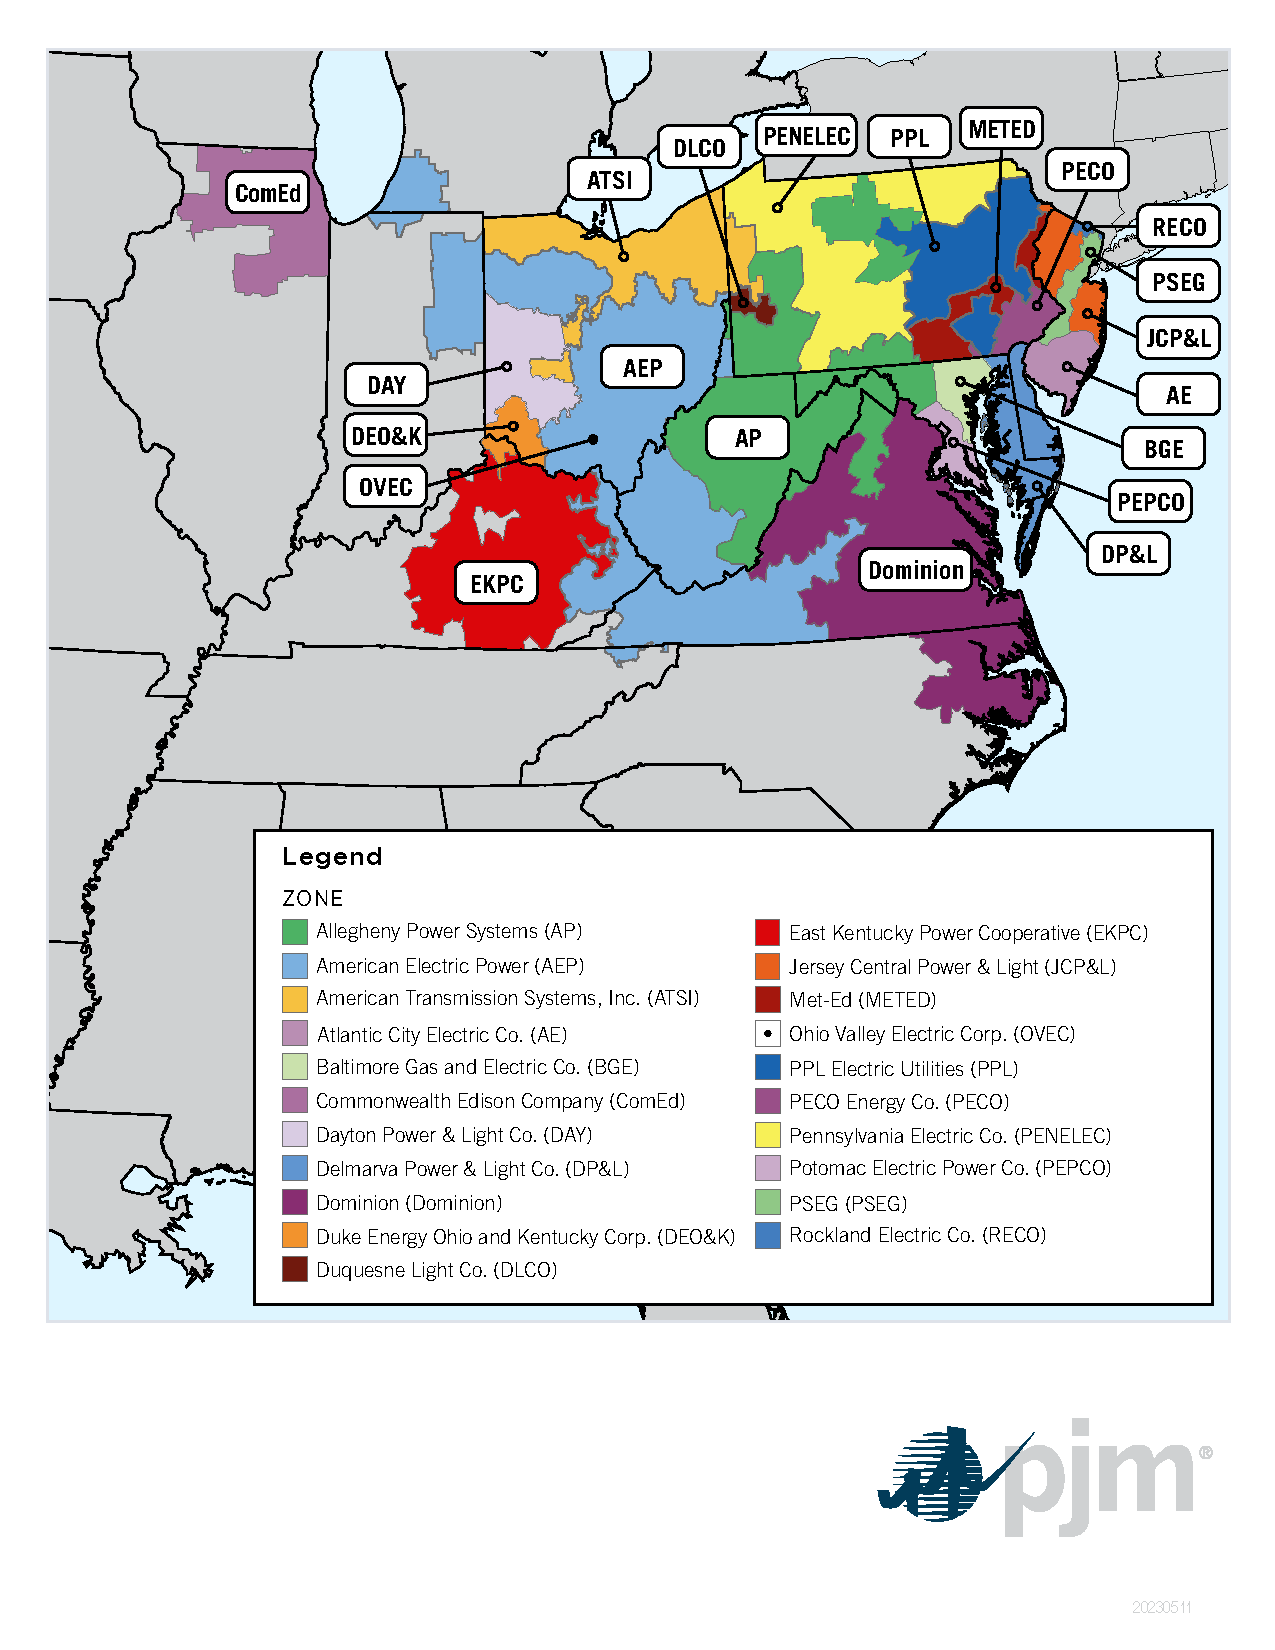
    PJM Transmission Zones map showing ComEd territory (purple, upper left) within the 13-state PJM grid
    PJM Interconnection transmission zones. ComEd (purple, upper left) covers northern Illinois. Source: PJM.com

    Illinois’ Clean and Reliable Grid Affordability Act now allows new nuclear development to begin in 2026 [16][17], reflecting confidence that steady baseload power complements renewables.

    Even Naperville’s current proposal – still under review after public debate – shows how local oversight and state-level policy align to manage growth responsibly [18][19].


    How Communities Manage Growth

    Across Northern Illinois, cities are shaping development on their own terms:

    • DeKalb has approved some projects and denied others – including a 2025 “boutique” data center and solar proposal on Peace Road that failed twice before the City Council [37].
    • Batavia capped water use at 1,000 gallons per day (gpd) and oversees the project through its municipal utility [8].
    • Yorkville & Plano require developers to fund all road, water, and utility extensions before annexation [32].
    • Rochelle has hosted data centers for more than a decade under its Rate 163 tariff, using local generation to stabilize customer rates [20][21].
    • Aurora enacted a temporary moratorium in Sept 2025 to update design and noise standards [22][23].
    • Naperville already operates several small facilities quietly within its business parks [18][19].

    Different paths, same outcome: clear expectations, transparent review, and measurable community benefit.


    Farmland and Land Use

    Illinois loses far more farmland to low-density residential sprawl than to any other type of development [27]. Modern data-center campuses are land-efficient – often only a few dozen acres per billion dollars of taxable value.

    By comparison, solar facilities like the Burr Oak Solar Project occupy approximately 2,000 acres for a capacity of roughly 200 MW  – 5 to 10 acres per MW [28][29]. Concentrating high-value, low-impact uses near existing transmission and fiber corridors helps preserve thousands of acres elsewhere for agriculture.


    Transparency and Trust

    Healthy skepticism makes communities stronger. Illinois’ Open Meetings and Freedom of Information Acts guarantee that local records are public [30][31]. Yorkville goes further, requiring an independent engineering review and continuous noise monitoring throughout each data center build [32][33].

    Open processes like these keep the conversation anchored in verifiable facts rather than speculation.


    Managing Construction and Operation

    Construction brings trucks and dust – that’s why Illinois’ Construction General Permit (ILR10) and local ordinances regulate work hours, runoff, and haul routes [24].

    Once operating, these facilities are tranquil. Backup generators are tested briefly each month under Illinois EPA permits that limit total runtime [25]. Landscaping, berms, and shielded lighting make them unobtrusive neighbors.


    Shared Benefits and a Path Forward

    Meta’s DeKalb campus alone has provided over $1 million in community grants to local schools and nonprofits [26]. Beyond those visible donations are quieter gains: modernized substations, stronger broadband routes, and more resilient municipal budgets.

    Handled responsibly, data-center growth strengthens the very systems every resident relies on. Northern Illinois can either lead this balanced progress – or watch the investment migrate elsewhere. Let the data guide that choice.

    Methods & Transparency

    I utilize a range of AI and automation tools, in conjunction with my own research, to organize and verify complex public data – from DeKalb County tax rolls and DevNet parcel records to PJM TEAC maps and ComEd reliability filings. ChatGPT has been the primary workhorse for synthesis, but I also utilize Copilot, Gemini, Claude, and Grok to cross-check facts, refine tone, and develop Python-based tools for analysis. Grammarly keeps the writing clear – I use it for nearly everything I write, even texts.

    Over the past several months, I’ve invested well over 100 hours reviewing, verifying, and refining this information. I have also permanently archived more than 100 key source documents in the Internet Archive’s Wayback Machine to ensure transparency and durability. The work is still ongoing as new filings and community feedback come in.

    Every figure and citation is sourced from public records that you can verify independently. My goal is to make complex infrastructure and taxation topics accessible and understandable to everyone in the community. I’m just a local guy with a day job and a family, trying to make the public data we already have a little easier for everyone to understand.

    If you’d like a deeper, fully-sourced explanation of why electric bills rose statewide, how PJM Interconnection pricing actually works, and what role data centers do and don’t play in local rates, see: Why Electric Bills Really Rose, and What It Means for Data Centers

    For the full breakdown of how EAV growth, levy decisions, and data-center contributions combine to affect property tax bills in DeKalb County, see: How Meta’s Data Center Affected DeKalb County Property Taxes (2020–2024)


    Sources & Archives (38 total)

    (All permanently archived via web.archive.org)

    This article is part of the Data Centers: The Public Record series. View all technical analysis →

    1 – DeKalb Co. parcel 08-35-300-010 (2024) – Meta Ventus campus assessment. https://web.archive.org/web/20251102183338/https://dekalbil.devnetwedge.com/parcel/view/0835300010/2024

    2 – City of DeKalb FY 2024 Tax Levy Memo (11-12-2024). https://web.archive.org/web/20241123035712/https://cityofdekalb.com/AgendaCenter/ViewFile/Agenda/_11122024-2614

    3 – DeKalb parcel 11-032-000-66 (2021). https://web.archive.org/web/20251102224656/https://dekalbil.devnetwedge.com/parcel/view/1103200066/2021

    4 – DeKalb parcel 11-032-000-66 (2024). https://web.archive.org/web/20251102224710/https://dekalbil.devnetwedge.com/parcel/view/1103200066/2024

    5 – DeKalb Park District 2025 Tax Levy Estimate & Rate History. https://web.archive.org/web/20251102171237/https://dekalbparkdistrict.community.highbond.com/document/13a4a189-cf56-4454-938f-ba9ef5a28ade

    6 – DeKalb CUSD 428 Early Learning Center Plan (2024). https://web.archive.org/web/20251103185226/https://go.boarddocs.com/il/dist428/Board.nsf/files/DMHQ9K683A17/$file/vision%20FOR28%20(2).pdf

    7 – Shaw Local (10-29-2025). https://web.archive.org/web/20251103184920/https://www.shawlocal.com/daily-chronicle/2025/10/29/dekalb-school-district-428-moves-forward-without-referendum-on-early-learning-center-plans/

    8 – City of Batavia Data Center Project (Hut 8). https://web.archive.org/web/20251102235655/https://il-batavia.civicplus.com/1248/City-of-Batavia-Data-Center-Project

    9 – U.S. DOE (2024) Best Practice Guide for Data Center Design §5.3. https://web.archive.org/web/20250918212357/https://www.energy.gov/sites/default/files/2024-07/best-practice-guide-data-center-design_0.pdf

    10 – Shaw Local (9-9-2025). https://web.archive.org/web/20251103141227/https://www.shawlocal.com/kendall-county-now/2025/09/09/yorkville-says-higher-water-bills-not-related-to-data-centers-but-higher-water-consumption-linked/

    11 – Meta Sustainability Blog (2023) “What Does It Mean to Be Water-Positive.” https://web.archive.org/web/20251103011415/https://sustainability.atmeta.com/blog/2023/03/15/what-does-it-mean-to-be-water-positive/

    12 – Meta Sustainability Blog (2023) “Our Journey to Water-Positive 2030.” https://web.archive.org/web/20251103011510/https://sustainability.atmeta.com/blog/2023/03/01/metas-edward-palmieri-shares-our-journey-to-achieve-water-positive-status-by-2030/

    13 – PJM Territory Served / ComEd Zone Map (2024). https://web.archive.org/web/20250107193805/https://www.pjm.com/-/media/about-pjm/pjm-zones.ashx

    14 – PJM Real-Time Energy Market Overview. https://web.archive.org/web/20251103191200/https://www.pjm.com/markets-and-operations/energy/real-time

    15 – Constellation + Meta (2025) Clean-Energy Agreement. https://web.archive.org/web/20251015123245/https://www.constellationenergy.com/newsroom/2025/constellation-meta-sign-20-year-deal-for-clean-reliable-nuclear-energy-in-illinois.html

    16 – Illinois Public Act 103-1079 (2025). https://web.archive.org/web/20251103193011/https://www.ilga.gov/legislation/publicacts/103/103-1079.htm

    17 – Capitol News Illinois (10-2025). https://web.archive.org/web/20251103142417/https://capitolnewsillinois.com/news/lawmakers-ok-sweeping-energy-reform-package-that-governor-pledges-to-sign/

    18 – NetSource Data Center Naperville. https://web.archive.org/web/20251022105043/https://www.netsource.com/web-hosting/chicago-datacenter/

    19 – Daily Herald (10-17-2025). https://web.archive.org/web/20251102234708/https://www.dailyherald.com/20251017/news/developer-revises-data-center-plans-naperville-residents-still-concerned/

    20 – City of Rochelle 2022 Utility Audit. https://web.archive.org/web/20251102173834/https://www.cityofrochelle.net/~documents/department-documents/finance/audits/22-final-audit-utilities-co-rochelle/?layout=file

    21 – Rochelle Municipal Utilities Rate 163 Tariff. https://web.archive.org/web/20251104115335/https://www.rmu.net/wp-content/uploads/Rate-163.pdf

    22 – City of Aurora Moratorium Page (2025). https://web.archive.org/web/20251102174548/https://www.aurora.il.us/Property-and-Business/Zoning-and-Planning/Data-Center-and-Warehouse-Moratorium

    23 – City of Aurora Ordinance O25-064 (9-2025). https://web.archive.org/web/20251102174840/https://www.aurora.il.us/files/sharedassets/mainsite/v/1/environment/documents/o25-064.pdf

    24 – Illinois EPA Construction General Permit (ILR10). https://web.archive.org/web/20251031193052/https://epa.illinois.gov/topics/forms/water-permits/storm-water/general-permits.html

    25 – Illinois EPA Air Permit Generator Runtime Limits (2023). https://web.archive.org/web/20251103180322/https://epa.illinois.gov/content/dam/soi/en/web/epa/topics/environmental-justice/documents/ira/ira-analyses/031063AUJ%2023050030.pdf

    26 – Meta Data Centers Community Grant Recipients 2021–2025. https://web.archive.org/web/20251102175450/https://datacenters.atmeta.com/2025-grant-recipients/

    27 – farmdoc daily (8-2024) “Agricultural Land Lost to Development in the Midwest.” https://web.archive.org/web/20251102175731/https://farmdocdaily.illinois.edu/2024/08/agricultural-land-lost-to-development-in-the-midwest.html

    28 – NREL (2013) Land-Use Requirements for Solar Power Plants in the U.S. https://web.archive.org/web/20251103180535/https://docs.nrel.gov/docs/fy13osti/56290.pdf

    29 – Burr Oak Solar Project Overview. https://web.archive.org/web/20251102231740/https://burroaksolar.com/

    30 – Illinois Open Meetings Act (5 ILCS 120). https://web.archive.org/web/20250918044223/https://www.ilga.gov/legislation/ilcs/ilcs3.asp?ActID=84&ChapterID=2

    31 – Illinois Freedom of Information Act (5 ILCS 140). https://web.archive.org/web/20250918044314/https://www.ilga.gov/legislation/ilcs/ilcs3.asp?ActID=85&ChapterID=2

    32 – City of Yorkville Development Standards Text Amendment. https://web.archive.org/web/20250612210415/https://www.yorkville.il.us/915/Data-Center-Development-Standards-Text-A

    33 – City of Yorkville Project Steel Page (Noise Docs). https://web.archive.org/web/20251029220340/https://www.yorkville.il.us/905/Project-Steel-Data-Center-Campus-Annex-A

    34 – City of Yorkville Council Packet (8-26-2025). https://web.archive.org/web/20251103181453/https://www.yorkville.il.us/ArchiveCenter/ViewFile/Item/6403

    35 – City of Yorkville Council Packet (10-28-2025). https://web.archive.org/web/20251030025207/https://www.yorkville.il.us/ArchiveCenter/ViewFile/Item/6480

    36 – NOAA / NCEI Illinois Billion-Dollar Disasters Summary (2024). https://web.archive.org/web/20250804110522/https://www.ncei.noaa.gov/access/billions/state-summary/IL

    37 – Shaw Local (9-24-2025) “Vote on ‘Boutique’ DeKalb Data Center, Solar Development Fails Again.” https://web.archive.org/web/20250925140312/https://www.shawlocal.com/daily-chronicle/2025/09/24/vote-on-boutique-dekalb-data-center-solar-development-fails-again/

    38 – DCEDC (2025) DeKalb County Enterprise Zone Incentives Summary. https://web.archive.org/web/20251104120025/https://dcedc.org/wp-content/uploads/2025/09/Enterprise-Zone-Incentives.pdf