I work at a local ISP in Northern Illinois and have worked in internet infrastructure here for two decades. I co-founded FD-IX, an internet exchange. I have no customer, vendor, or interconnection relationship with any facility or developer named here, and no financial position in any of them beyond broad-market index funds. Hyperscale campuses buy transport from national carriers and interconnect through private circuits or at large national exchanges, so that traffic does not typically land at a regional exchange like FD-IX. My industry grows with infrastructure investment, roughly as an independent auto shop does when a vehicle assembly plant opens in the county: the plant buys its parts elsewhere, and the shop still benefits from the regional economy around it. That is an indirect interest, not a direct one, and it is the interest I have here.
TL;DR
- Data center environmental impact depends on grid, cooling design, hydrology, and siting. Grid NOx alone varies nearly fourfold across the eGRID subregions compared here, 0.202 to 0.787 lbs per MWh, and Illinois itself spans three subregions depending on the serving utility. [1][1a]
- Northern Virginia’s air quality problem is generator density, not the grid. Loudoun County holds nearly half of Virginia’s more than 13,500 diesel generators in data center air permit applications, sits inside an ozone nonattainment area, and Virginia’s grid runs below the national NOx average. [1][4d][3] DeKalb County and most of Kendall County are in attainment. [5a] One piece of the Virginia concern does transfer: in 2026 the Department of Energy issued emergency orders, nine by PJM’s count, that let PJM, the grid operator for ComEd’s Northern Illinois territory, direct data center backup generators to run during grid emergencies. [5e][5d][5h][5i] PJM says it has not used that authority to date. [5i] Illinois requires Tier 4 or equivalent controls on diesel generators at data centers that need a federally enforceable state or Title V operating permit, for construction permits applied for from December 2026. [5c]
- Water is a corridor question. Nationally, data centers consumed 17.4 billion gallons directly in 2023 [7], about 0.045% of U.S. irrigation withdrawals [8], a ratio that sets scale only. Yorkville draws from an aquifer withdrawn about twice as fast as it recharges. [9b] Its engineer projects the city and eight data center developments at 3.66 million gallons a day by 2050, slightly above its 3.566 million-gallon Lake Michigan allocation, and finds no data center-driven system improvements needed for three to ten years. Spare pipeline capacity does not raise the allocation. [11r] Illinois requires no state permit to withdraw groundwater from a private high-capacity well outside the Lake Michigan allocation; the well itself needs a construction permit, and a large withdrawal needs notice and registration. [9e]
- Three widely cited incidents sit in three different tiers. xAI is alleged to have run unpermitted gas turbines in Memphis and Southaven, 57 on the Southaven site by the plaintiffs’ June 2026 count. [6a][6c] Fayette County attributes QTS’s 29 million unbilled gallons to its own meter transition. [13a] Four Georgia families are suing Meta over well damage they attribute to construction [29b], and EPA calls its review information gathering, not an investigation. [29] Of the three, only xAI is alleged to have operated equipment without a required permit.
- One circulating claim has no evidentiary basis: harm from inaudible infrasound. [32a] Virginia’s rebuttal of an advocacy health estimate is less clean than it looks. Virginia DEQ concluded, on modeling grounds, that an advocacy-commissioned health analysis of Vantage’s VA2 campus overstated health damages by at least an order of magnitude, while stating it has no health expertise. [19a] Its author told E&E News that a rerun on DEQ’s own emissions figures still estimated $33 million to $63 million a year; the rerun itself is unpublished. [19c]
How the Claims Travel
The environmental claims addressed here start with real cases somewhere else. They arrive in Northern Illinois without the grid, cooling design, hydrology, siting, and regulatory context that made those cases true.
A noise complaint from Chandler, Arizona, a nitrate contamination lawsuit from Morrow County, Oregon, and a diesel generator study from Loudoun County, Virginia, all describe real documented problems. They do travel, and the Yorkville record shows every direction they travel in.
The opposition’s version came first. A resident at the Kane County line wrote to the city in March 2025 that a data center of this size could cause “neurological and mental health stressors in addition to medical issues and complications,” citing a Washington state agency’s data center page, EPA’s diesel exhaust material, the American Cancer Society, and California’s diesel particulate summary, none of them about this site or this grid. The city administrator’s reply was itself an import: staff had “spoken with our government counterparts in Loudoun County, Virginia, which is the data center capital of the world,” who said noise complaints were the most frequent issue “but they tended to downplay the severity of it.” [11w] Six weeks later, the city’s planner put Loudoun County, Prince William County, and Chandler side by side in a memo and drew Yorkville’s first data center standards from them. [11w]
The developer’s version followed. At the July 2025 public hearing, Project Cardinal’s representative testified that homes within 500 feet of data center campuses in Ashburn, Virginia, had appreciated about 70% over the past decade and that legacy Ashburn campuses sit as close as 100 to 130 feet from residential property lines, offering no source for either figure. [11y] When the same developer presented an “Air Quality Profile” to the City Council on March 10, 2026, its baseline slide was built from Virginia’s JLARC study, the Piedmont Environmental Council’s report, and Virginia DEQ permit data, and its headline was that over 89% of Virginia’s data center backup generators run with Tier II controls. [11v] Those are two different uses of Virginia. Benchmarking engine controls against Virginia’s fleet is a fair comparison against a national standard. An unsourced Ashburn home-value figure offered as evidence about Yorkville is the same move this article faults in the opposition: a conclusion from one place carried to another without the conditions that produced it.
Virginia and Arizona arrived in Yorkville four ways in one year: as the opposition’s evidence, as the developer’s sales pitch and its benchmark, and as the city’s template. Not all four are errors. A city borrowing setback and measurement rules and adapting them, as Yorkville’s planner said it would, is how standards should travel. [11w] The error is carrying a conclusion. When a conclusion travels, the geographic conditions that made it true do not come along. The grid mix doesn’t come along. The cooling technology doesn’t come along. The nonattainment designation doesn’t come along.
What comes along is the conclusion.
The industry is not blameless here. Operators have used nondisclosure agreements to keep local governments from disclosing basic project terms to residents, marketed annual renewable energy certificate accounting as “100% renewable” power, and stayed silent when other operators faced credible permit-violation allegations. The information vacuum the industry creates through opacity fills with whatever the opposition supplies first. This publication has called for operators to stop using NDAs as a condition of community engagement. [23]
The opposition has its own problems. Claims built on another region’s conditions get repeated at Illinois hearings without the context that made them true. In the case examined below, an advocacy-commissioned report’s death and damage estimates were public for seven weeks before state regulators published a formal response, and the response then drew scrutiny of its own. [19b][19a][19c]
How This Article Sorts the Claims
The article covers thirteen categories of environmental concern: grid air quality, diesel generator emissions, water supply, water quality, cooling wastewater, noise, construction, thermal effects, land and habitat, light pollution affecting wildlife, light pollution affecting human health, chemical hazards, and electromagnetic fields. A category is the type of concern. It is not a verdict.
The verdict attaches to a specific complaint. Within each category, the article states the complaints in the form they usually take at hearings and rates each one on the scale below. Quotation marks in a claim mark words quoted from the record; the rest are paraphrases of claims in circulation. Any category can hold complaints at any tier: a real noise problem in Chandler and a fabricated infrasound mechanism are both noise complaints. A few of the claims rated here are the industry’s rather than the opposition’s, promises of benefit rather than allegations of harm. Those are rated Contested when the mechanism is plausible, and the measurement that would settle it does not exist yet.
Systemic: documented at compliant facilities across multiple geographies. Regional: real, but only under specific geographic or operational conditions. Isolated: documented at one or few facilities due to misconduct or atypical design. Exaggerated: the concern is real, but the figures represent permit ceilings or worst-case scenarios, not operational norms. Selective: a legitimate concern applied only to data centers, not to comparable land uses. Misattributed: the harm is real, but the source, geography, or cause is wrong. Contested: a plausible mechanism exists, but causal documentation at compliant facilities does not. Fabricated: no credible evidentiary basis exists.
One sourcing error recurs often enough to name before the categories: reading a permitted ceiling as an operating forecast. A permit authorizes a maximum. EPA rules allow emergency engines up to 100 hours a year for maintenance checks and readiness testing, no more than 50 of which may be other non-emergency operation, and Virginia’s JLARC found the state’s data center generators emitted roughly 7% of what their permits allowed in 2023. [5][4] A report that models the ceiling as if it were operation, without saying so, produces a technically authorized but operationally misleading figure.
When this article says I found no record of something, it means I searched public sources, agency websites and regulations, permit and court documents posted online, peer-reviewed literature, and news coverage through October 2026. It did not include paid legal databases, court dockets that require an account, or public records requests. A “found no” is a statement about that search, not proof that the thing does not exist. Advocacy organizations cited on either side are identified as such in the citations.
Air Quality: The Grid
Claim: A data center brings its grid’s emissions with it. Tier: Regional.
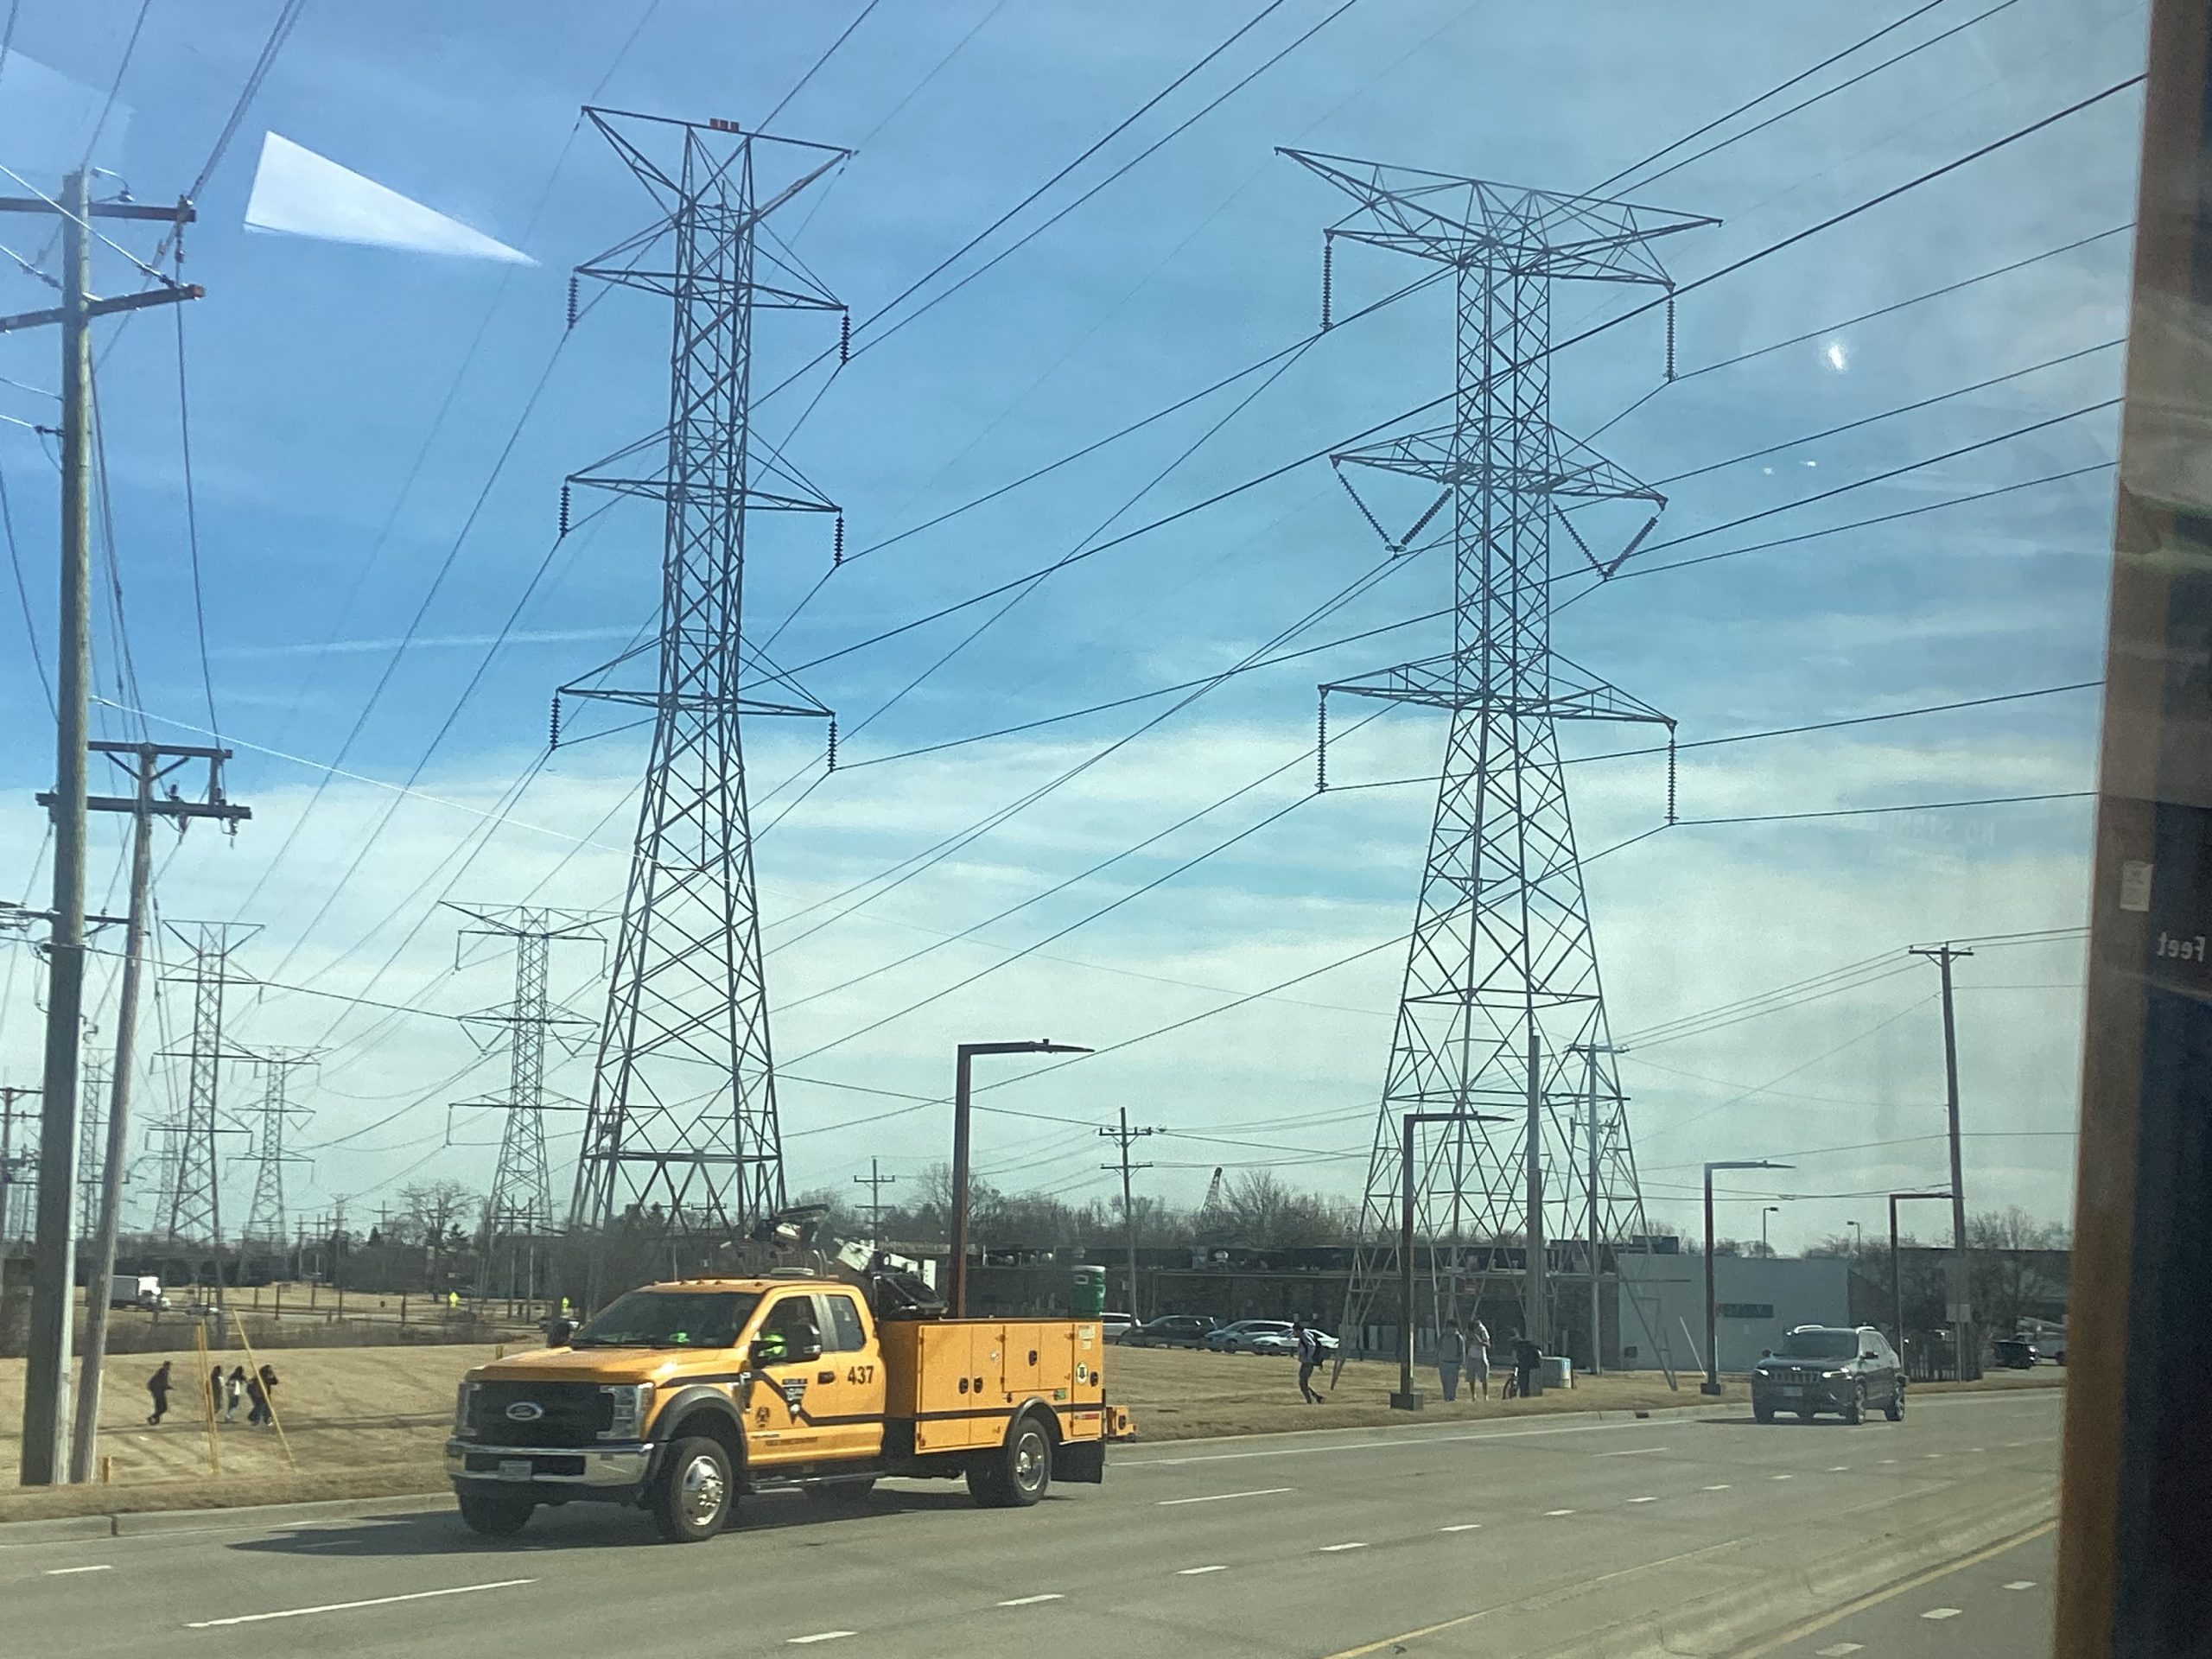
True, and the size of it depends on which grid. eGRID 2023 shows a factor-of-four spread in NOx output across the subregions in the table below. [1] The subregion that includes ComEd’s Northern Illinois territory along with Ohio, Indiana, and parts of several neighboring states (RFCW) produces 0.422 lbs of NOx per megawatt-hour (MWh). The subregion that includes Missouri and Ameren’s downstate Illinois territory (SRMW) produces 0.787. Virginia’s subregion, SRVC, produces 0.282. The national average is 0.452. Across all subregions, the range runs from 0.083 in upstate New York to 8.139 in parts of Alaska.
| Grid Region | Territory | NOx (lb/MWh) | Sulfur dioxide, SO₂ (lb/MWh) |
|---|---|---|---|
| SRMW | SERC Midwest (Missouri, downstate Illinois under Ameren) | 0.787 | 1.636 |
| RFCW | RFC West (N. Illinois under ComEd, Ohio, Indiana, parts of neighboring states) | 0.422 | 0.412 |
| U.S. National | National average | 0.452 | 0.359 |
| SRVC | SERC Virginia/Carolina (Virginia, Carolinas) | 0.282 | 0.152 |
| RFCE | RFC East (Mid-Atlantic, not Virginia) | 0.202 | 0.212 |
| NEWE | New England | 0.291 | 0.116 |
Source: EPA eGRID 2023 Summary Tables [1]; territory assignments from EPA Power Profiler [1a]
eGRID subregions are drawn for emissions accounting. They do not follow state lines, utility territories, or the footprints of PJM and MISO, the grid operators that actually dispatch the plants. EPA’s Power Profiler places Commonwealth Edison’s territory, which includes DeKalb, Kane, and most of Kendall County, in RFCW; Ameren Illinois territory downstate in SRMW; and the Quad Cities in MROW. For the Yorkville ZIP code, it returns either RFCW or SRMW depending on which utility serves the parcel. [1a] One state carries three subregion averages.
Averages also are not the margin. The unit that serves new load varies by hour, node, congestion, and season, and I did not find PJM, MISO, EPA AVERT, or NREL Cambium data tying any proposed Illinois facility to a marginal-fuel profile, so I do not state one. Data center load growth as a grid planning and reliability problem is a separate question, covered in the electricity piece in this series.
Claim: Data centers here will emit as they do in coal country. The reverse claim: Illinois is mostly nuclear, so a data center here is clean. Tier for both: Misattributed.
Both carry the wrong average to a specific site. A site served by ComEd sits in RFCW at 0.422 lbs NOx per MWh; a site served by Ameren sits in SRMW at 0.787. [1][1a] An SRMW figure carried north is the wrong number in the wrong place. So is Illinois’s generation mix, 54.9% nuclear and 12.3% wind in eGRID’s 2023 state table, carried to any particular site. [1] Nuclear plants run as baseload, holding steady output around the clock rather than ramping to serve new demand, so the state’s clean production average doesn’t serve incremental load any more than the coal-heavy subregion average does.
Claim: On-site gas generation is cleaner than the grid. Tier: Contested.
This is the industry’s claim, and it has a real mechanism in the right place. In a coal-heavy subregion like SRMW, if a coal unit sets the margin at a given node and hour, a modern gas plant behind the meter can be cleaner than the unit it displaces. Establishing that takes hourly marginal-emissions data for the node, and I found no such analysis for any proposed facility. What holds without it is narrower: on-site gas puts a combustion source at the property line that grid service does not. That is a statement about where emissions land, not the net total, and no party in any Illinois proceeding I reviewed has shown that on-site generation reduces emissions relative to grid supply during the hours the facility would draw power. The Yorkville proposals avoid the question; Project Cardinal’s PUD agreement commits it to take all primary power from the ComEd grid. [11x]
Air Quality: Diesel Generators
Claim: Data center generators are degrading air quality in Northern Virginia. Tier: Regional.
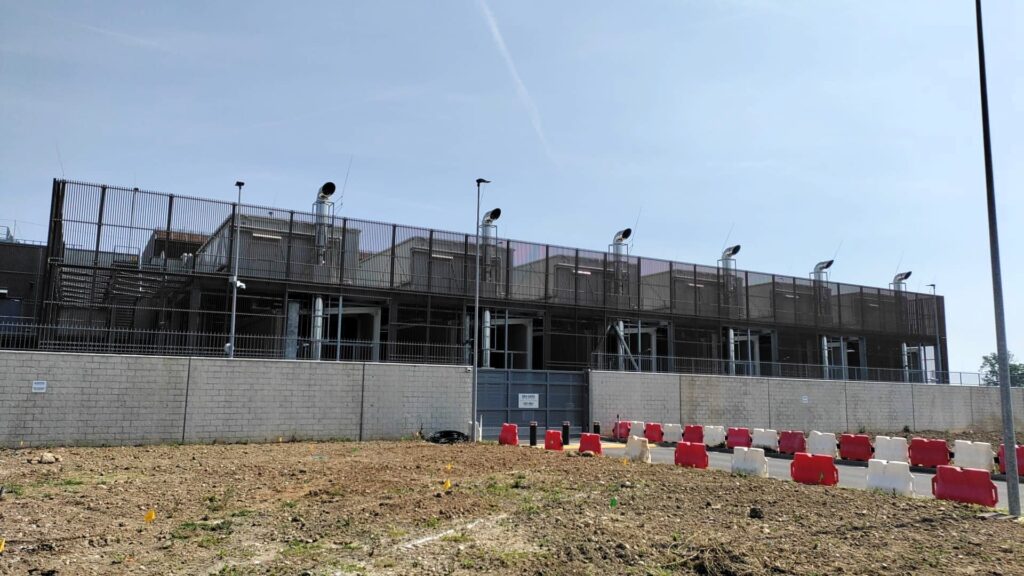
True in that place, for reasons specific to that place. The problem isn’t Virginia’s grid, which runs below the national NOx average at 0.282 lbs per MWh. [1] It is the concentration of diesel backup generators in Loudoun County, which holds nearly half of the more than 13,500 covered by Virginia data center air permit applications as of September 2026, inside an area designated nonattainment under the 2015 ozone National Ambient Air Quality Standards (NAAQS). [3][4d] Published counts vary with date and method: December 2025 reporting put the state at about 9,000, and a Washington Post analysis of permits through 2024 put it at 10,500. [4a][4e]
Virginia’s Joint Legislative Audit and Review Commission (JLARC) found in its December 2024 study that generators make up less than 4% of Northern Virginia’s regional NOx emissions. It separately reported that actual 2023 emissions were 7% of what permits allowed, and that most generator emissions come from maintenance testing. It concluded that generator emissions are unlikely to adversely affect regional air quality, but that local effects are a separate question: the industry’s generator clusters have no parallel in other development, their intermittent use makes them difficult to model, and regional monitoring does not capture localized effects. [4] Permits are issued and capped per site, so each campus is evaluated on its own fleet rather than as part of a cluster drawing on a shared airshed, the volume of air a region’s sources all emit into and all breathe from. Almost one-third (29%) of operational data center properties in Virginia sit within 200 feet of residentially zoned land. [4][4c]
The legitimate concern lives in the gap between “less than 4% of regional NOx” and an outage nobody has modeled. JLARC sized the worst case, every Northern Virginia data center at its maximum allowed emissions as a prolonged multi-county outage could cause within a few days, at over 9,000 tons of NOx, about half of what all sources in Northern Virginia typically emit in a year, and did not model its effect on air quality. [4] Scheduled testing runs unit by unit. A regional outage occurs when simultaneous activation becomes plausible, and I found no published model for it.
A single-facility version has already happened. Vantage’s VA2 campus in Sterling ran its backup generators for almost 24 hours on July 16 and 17, 2026, after a power failure, while the region was already under degraded air quality from Canadian wildfire smoke. A neighbor reported a 60-decibel reading at his property line, using a method the report does not describe, which exceeds Loudoun County’s 55-decibel nighttime limit. Virginia DEQ Director Michael Rolband told him the agency lacks “regulatory authority to stop these actions undertaken in response to the emergency.” [4b] That is the rule working as written: federal standards put no hour limit on emergency operation. [5] DEQ has since installed its first five sensors in eastern Loudoun, measuring fine particulate, carbon monoxide, and nitrogen dioxide since March 2026, as part of a three-year study to measure generator effects directly. [19][4]
Claim: What happened in Loudoun County will happen here. Tier: Misattributed.
The nonattainment baseline does not transfer. DeKalb County is designated attainment/unclassifiable for the 2015 ozone standard and for the annual and 24-hour fine particulate standards. [5a] Kendall County is only partly in the Chicago, IL-IN-WI nonattainment area for the 2015 ozone standard, and the part is Oswego Township; the area was reclassified as Serious effective January 16, 2025. [5a] At that classification, a new source counts as major at 50 tons per year of NOx or volatile organic compounds rather than 100, with a volatile organic compound offset ratio of at least 1.2 to 1. [5a][5b] A generator yard in Oswego Township is permitted under those thresholds; the same yard elsewhere in Kendall County is not.
The engines would also be cleaner. The federal rules are the same in both states: New Source Performance Standards under 40 CFR Part 60 Subpart IIII set criteria-pollutant limits at manufacture, RICE NESHAP under 40 CFR Part 63 Subpart ZZZZ governs hazardous air pollutants, testing is capped at 100 hours a year with up to 50 for other non-emergency use, and emergency operation has no limit. [5] Illinois has gone further. Public Act 104-0458, effective June 1, 2026, applies to data centers whose generators need a federally enforceable state operating permit or a Title V permit. For construction permits applied for from December 2026, it requires each diesel backup generator to meet standards “at least as protective as Tier 4” for nonroad diesel engines and to run only as an emergency or standby unit; gas generators must meet Tier 2 for large spark-ignition engines. A generator that falls out of Tier 4 compliance during a power outage may run up to 24 sequential hours without violating the permit. [5c] A Tier 2 engine with add-on controls can qualify as equivalent, and existing generators are untouched. [5c] Smaller campuses permitted below those thresholds are outside the requirement. Virginia had one Tier 4 data center when JLARC counted. [4] Project Cardinal’s developer told Yorkville’s council in March 2026 it would exceed the statute: particulate filters, selective catalytic reduction, and oxidation catalysts on every generator; renewable diesel as fuel; and testing only between 11 a.m. and 5 p.m. on non-holiday weekdays. [11v]
How often they would run is a promise, not a measurement. Cardinal’s representative testified in July 2025 that testing “is only going to occur once or twice a year” and that generators at campuses like this “are really never used outside of testing.” [11y] The federal ceiling is 100 hours. I found no dataset of typical testing hours at compliant data centers, and the continuous monitors Yorkville required are the only instrument on the record that will produce one.
Proximity does transfer, as a fact about the corridor rather than an import. Yorkville’s planning staff built the Virginia measure for the Eldamain corridor in May 2025: of twelve data center projects approved, under review, or in site inquiry, four sat within 200 feet of a residential property line, two of them immediately adjacent. [11w]
Claim: In a grid emergency, every data center’s generators will run at once. Tier: Contested. Authorized nine times in 2026, used none.
This is the part of the Virginia concern that does transfer, and it has moved from hypothetical to authorized. In 2026, the Department of Energy issued Federal Power Act section 202(c) emergency orders, nine by PJM’s count, letting PJM, the grid operator for Northern Virginia and for ComEd’s territory in Northern Illinois, direct backup generation at data centers and other large loads as a last resort before or during a level 3 Energy Emergency Alert, the stage at which firm load may be shed. Each order covers one emergency, from a few days to four weeks. [5e][5d][5h][5i] PJM asked that the generators be allowed to run “notwithstanding any applicable environmental limitations”; the orders instead require operation consistent with environmental law “to the maximum extent practicable.” [5f][5h] When an order is in effect, it applies to every ComEd-served proposal in DeKalb and Kendall County, and it hits during the grid’s most stressed hours, which in summer are also ozone-forming. That timing point reflects how the orders are triggered, not a finding in them.
PJM has not used the authority. David Souder, PJM’s executive director of system operations, wrote on October 15 that “PJM did not use that authority and has not done so to date.” [5i] That is why this is Contested rather than Regional: authorized nine times, used none.
The Yorkville record shows the gap. Cardinal’s developer told the council in March 2026 that its PUD agreement permits no backup generator dispatch other than testing. [11v] Eight months earlier, its representative had described the other case under oath: “if it’s curtailed in an emergency, we would be curtailed first, and we would have backup generators.” [11y] The agreement’s freeze on new city standards yields “to the extent required by state or federal law.” [11x] Whether a city agreement can keep generators off when PJM directs them on under a federal order is a question nobody in the Yorkville record asked.
Claim: Data center generators are uniquely dirty. Tier: Selective. The rule is shared; the engine count is not.
The same federal emergency-engine rules govern backup generators at hospitals, water and wastewater plants, and other critical facilities. [5] (The DOE emergency orders run the other way: they exclude hospitals, 911 centers, and similar facilities from the generators PJM may direct. [5d]) What differs at a data center campus is the number of engines on one site, and the engine count is the number to compare. Illinois has it, campus by campus, in Illinois EPA’s permit files.
Quick Compare: diesel generators in four Illinois EPA air records
| Campus | Record | Engines | Capacity | Hour limit |
|---|---|---|---|---|
| CyrusOne, Aurora | Draft Title V permit, March 2026 | 91 | about 211 MW | Not stated in summary read |
| Microsoft, Hoffman Estates | Construction permit, December 2024 | 34 | about 100 MW | 1,984 hours combined for the 32 large units |
| Prime, Elk Grove Village | Construction permit, July 2025 | 39 | about 127 MW | 35 hours per engine |
| Stream, Elk Grove Village | Application, January 2026 | 126 | 315 MW | Pending |
Source: [5j]. Capacity is the sum of the listed engine ratings.
Those four come to 290 engines and about 753 MW, all in the suburbs. [5j] The issued permits also cap testing well under the federal 100 hours. Annual attainment also does not address short-term exposure. Diesel exhaust carries fine and ultrafine particulate, black carbon, and hazardous air pollutants; EPA sets a 1-hour NO2 standard and a 24-hour fine particulate standard alongside the annual ones, and the hazardous air pollutants in diesel exhaust have no ambient standard. What a resident 200 feet from a generator yard breathes during a testing cycle or a multi-hour outage depends on engine tier, aftertreatment, stack height, and dispersion. Illinois EPA’s modeling memoranda carry that analysis for some suburban campuses. For Prime, the applicant’s consultant ran a cumulative 1-hour NO2 model of the area, including nearby sources and background, that found modeled exceedances of the standard, and Illinois EPA’s modeling unit confirmed Prime’s own maximum contribution at those points at 0.16 micrograms per cubic meter against a 7.52 significance level. [5j] I found no such filing for any DeKalb or Kendall proposal.
Claim: Data centers run unpermitted power plants. Tier: Isolated.
xAI is the case behind this claim, and the allegations describe operator conduct, not the building type. According to the Southern Environmental Law Center, xAI installed as many as 35 gas turbines at its Colossus 1 facility in Memphis without air permits after announcing it in June 2024, then removed the unpermitted units after a June 2025 notice of intent to sue, and the Shelby County Health Department permitted 15 on July 2, 2025, on the position that the earlier units were exempt nonroad engines, which SELC disputes. [6a] At its Southaven, Mississippi site, the NAACP’s April 2026 Clean Air Act suit alleges unpermitted turbines that could emit more than 1,700 tons of NOx a year, and the plaintiffs counted 57 on site by June 2026, contrary to Mississippi DEQ’s position that temporary units need no permit. [6b][6c] No court or agency has issued a final finding. The Memphis area was nonattainment for the 2008 ozone standard until EPA redesignated it in 2016 under a maintenance plan running through 2027. [6d] The alleged pattern is operating unpermitted combustion equipment, removing it under legal threat, and repeating the approach across a state line. Whether that was deliberate is what the litigation will decide.
Water Supply
Claim: Data centers are draining the country’s water. Tier: Selective.
Data centers use little water at the national scale, and national scale is the wrong unit for a siting decision. Lawrence Berkeley National Laboratory’s congressionally mandated 2024 report found U.S. data centers consumed about 17.4 billion gallons directly through on-site cooling in 2023. [7] U.S. crop irrigation withdrawals average 105.5 billion gallons per day, about 38.5 trillion gallons a year, under USGS’s current national estimate. [8] Data centers’ direct consumption is about 0.045% of that. The comparison has limits on both sides: the data center figure excludes water used to generate the facility’s electricity, which on a thermoelectric-heavy grid can exceed on-site use; the agricultural figure is withdrawal, some of which returns to the basin; and neither is weighted for scarcity. U.S. golf courses used 1.63 million acre-feet for irrigation in 2024, about 531 billion gallons and roughly 30 times data centers’ direct use, according to GCSAA’s peer-reviewed national survey. [20] Treating data centers as a uniquely large national water consumer doesn’t hold up to that comparison. Whether a given facility strains a given system is a different question.
Claim: Data centers strain local water supplies. Tier: Regional.
They can. Google’s Council Bluffs, Iowa location, the highest-withdrawal site in its own table, withdrew 1,410 million gallons in 2024 and consumed 1,010 million, about 3.9 and 2.8 million gallons a day. [9] In Newton County, Georgia, published figures for a single Meta facility disagree by a factor of five: the water authority’s director told The New York Times it uses about 10% of the county’s daily water, and WSB-TV reported about 102,000 gallons a day, about 2%. [29][10a] The Times reported the county on track for a water deficit by 2030, and the Lincoln Institute reported pending requests from new projects of up to 6 million gallons a day, more than double current county use. [29][10] These are genuine problems in specific places.
Claim: Phoenix’s water problem is coming here. The reverse claim: we’re next to the Great Lakes, so water isn’t an issue. Tier for both: Misattributed.
Both are wrong for the counties where this corridor’s buildout is concentrated. DeKalb County draws 100% of its water from groundwater and has no connection to Lake Michigan. [9a] That characterizes the source, not any campus’s effect on it. The campus already running in the county gives the first local measurement. Meta reports its DeKalb data center withdrew 105 megaliters in 2024, about 76,000 gallons a day on average, and DeKalb’s city manager has described its cooling draw as up to 200,000 gallons a day. [10c] The city’s water agreement reserves 400,000 gallons per peak day for each of three tiers, up to 1.2 million gallons total. [10b] Yorkville draws from a deep sandstone aquifer that the Illinois Office of Water Resources found is being withdrawn about twice as fast as it recharges, which is why Yorkville, Oswego, and Montgomery are building a 30-mile, roughly $400 million pipeline to Lake Michigan water through the DuPage Water Commission, expected in Yorkville by summer 2028. [9b][9c][9d] That is a real constraint with different hydrology from a desert: a depleting confined aquifer, not river allocation or reservoir drawdown. A claim about DeKalb, built on Maricopa County, isn’t an honest argument. Neither is the claim that Great Lakes adjacency makes supply comfortable here.
Claim: Project Cardinal will draw 350,000 gallons of city water a day. Tier: Exaggerated. A superseded figure cited as the operative one.
Cooling design matters more than facility size. Evaporative towers reject heat by evaporating water and continuously consume it. Closed-loop air cooling recirculates a fixed charge of fluid and draws water mainly to fill and top off the loop. Yorkville is the clearest local test, because the numbers are on the record at every stage.
The city presented Project Cardinal at 350,000 gallons per day (gpd) at full build-out across 14 buildings in October 2025, up from 310,000 a month earlier, without naming the cooling method; officials called it “about half the usage of a residential subdivision” on a per-acre basis. [11a][11c] By the March 2026 approval, the design was air-cooled closed loop. The Utility and Infrastructure Agreement allocates 42,000 gpd on an average day and 71,400 on a maximum day, and a memorandum of understanding approved 5-1 on June 23, 2026 restates the penalties: neither number triggers a shutoff, and usage above either is billed at twice the volumetric rate. [11o][11e] The memorandum calls the allocation “potable water” and does not divide domestic use from cooling. [11o]
| Project | Site | Initial figure | Approved limit | Homes equivalent |
|---|---|---|---|---|
| Project Cardinal | 1,037 acres | 350,000 gpd, cooling method not stated in source | 42,000 gpd average day; 71,400 gpd maximum day; double-rate penalty above either | 141 homes |
| Project Steel | 540 to 550 acres, reported both ways | 130,000 gpd (September 2025) | 25,000 gpd average; roughly 42,400 to 42,500 gpd peak, air-cooled | 90 to 120 homes |
| CyrusOne | 228 acres | 500,000 gpd | 40,000 gpd maximum | Not separately reported |
Sources: [11a][11e][11f][11g][11h][11i][11r]. Homes-equivalent figures are the city’s and the reporting’s, not this article’s derivation.
The 350,000 figure is no longer operative. The opposite reading, that Yorkville negotiated Cardinal’s water down by 88%, also doesn’t hold up well. The city engineer’s March 2026 study lists Cardinal at 42,000 and 71,400 gpd in a table of developer estimates received August 29, 2025, six weeks before the 350,000 figure went to the council. [11r] The developer’s September 2025 memo calls its figures “domestic water usages” and its closed-loop makeup water “undetermined.” [11n] The sanitary district said in February 2026 that the projects’ cooling “now will not use water,” while noting it had received no plans. [11p] And in March 2026 Shaw Local described Cardinal as “trucking in its own water for a closed-loop system.” [11h] My reading of those documents, which the city has not confirmed, is that 42,000 gpd is the domestic component that was there all along, about 3,000 gallons per building per day, the scale of restrooms and kitchens. A closed-loop, air-cooled system has no continuous evaporative demand; it only needs water for the initial fill and top-off, which the trucking account would cover. If that reading is right, the change from 350,000 is mostly the removal of evaporative cooling, not a negotiated cut. The memorandum calls the allocation potable water and does not divide domestic from cooling use, so the record does not settle it. [11o] Either way, 42,000 is an allocation with a price above it, not a forecast of draw, and the claim that this tier rates the municipal draw; total site water on the same accounting boundary is not on the record.
Instead of water, what moved is the other half of the record. Air cooling rejects the same heat with fans, which means more electricity for the same computing load and more mechanical noise at the property line, and air-cooled designs run hardest in the hottest hours, when neighbors are most likely to have windows open. Chandler’s planning staff tied rising neighborhood noise to the industry’s move from water-cooled to electrically cooled facilities. [36a] Northern Illinois has more cool-weather economizer hours than Phoenix, which makes the trade more plausible here, but calling it favorable would take the marginal-emissions profile for the hours cooling load rises and the modeled sound power for the approved design, and neither is in the approval record. A community that negotiates water down should ask what noise and power numbers it gets in exchange. Yorkville’s continuous noise monitoring condition is that question in permit form.
Residents dispute that the process worked at all. In April and May 2026, a resident group sued the city over the Cardinal and Steel approvals, alleging Yorkville rezoned more than 1,000 acres without a noise analysis, a traffic study, or an analysis of cooling water consumption, and without mailing notice to owners within 500 feet. [11l] The allegations are unadjudicated. If they hold, the water figures above were settled without the study that would have grounded them, and the city’s system-capacity study arrived as a presentation on the night the council approved Cardinal’s utility agreement. [11r] The record shows the approved allocations are lower than the figures first presented. It does not show whether that reflects the process working or design choices the developers would have made anyway.
Claim: The data center corridor will outrun Yorkville’s water. Tier: Contested. A forecast built on developer estimates.
Individual allocations are the wrong unit, as they are for generators in Loudoun County. As of March 2026, developers had 12 projects covering 3,016 acres approved, under review, or in site inquiry along Yorkville’s Eldamain Corridor. [11h] The city’s engineer, in a study funded by the Cardinal and Steel developers, totals eight projected developments at about 98,400 gpd on an average day and 174,600 on a maximum day. [11r] With the city and every projected data center built out, average-day demand reaches a projected 3.66 million gallons by 2050, slightly above the city’s 3.566 million gallon Lake Michigan allocation. [11r] The study shows another 3.0 million gallons a day of physical pipeline capacity, but pipe capacity is not the allocation the demand is measured against; demand above 3.566 million gallons would need a larger allocation or another source, and the study does not say which. It found no significant system improvements needed for the data centers in the next three to ten years. [11r] It is a progress presentation built on developers’ August 2025 estimates, not a final report or metered use, and it replaced a June 2025 city projection of about 200 million gallons a year that predated the design changes. [11j]
Claim: Data centers will pull from the aquifer our wells draw on. Tier: Contested. In the interim, the city claims they will draw through city wells; state law permits private wells, and no one has proposed them; the effect on residents’ wells is unmeasured.
A resident at the Kane County line raised this in March 2025, noting that many neighbors are on private wells. The city administrator answered that none of the nearby data centers would use well water, “neither their own or the City wells,” and that they “are not anticipated to begin operation until well after we have converted to the Lake Michigan source.” [11w] Three months later he told the council something broader: if data centers are built before the pipeline is complete, “they will use Yorkville’s well water in the interim.” [11j] That is city well water from the same aquifer, under the municipal allocation. No Yorkville data center is operating yet, and Lake Michigan water is due in summer 2028, so the interim has not started. [11z] No proposal I read includes a private well. But municipal allocation isn’t the only way to get water on a 1,037-acre parcel. Illinois’s Water Use Act of 1983 governs groundwater quantity under a reasonable-use rule and provides no withdrawal permit outside the Lake Michigan allocation system. A new withdrawal expected to exceed 100,000 gallons on any day requires notice to the county Soil and Water Conservation District, a 30-day review, and registration; restriction comes only after an investigation finds a substantial groundwater decline. [9e] The well needs a construction permit, which governs how it is built, not how much it pumps. [9f] None of that is a cap. None of Cardinal’s three agreements prohibits a private well. [11x][11o] The city code requires connection to city water for parcels “within a subdivision,” and the record I read does not answer whether that applies to the Cardinal parcel. [11b]
Claim: Data centers are why our water rates are going up 20% a year. Tier: Misattributed.
Yorkville approved residential rate increases of about 20% a year for five years to pay for the Lake Michigan pipeline. [9d][11a] The pipeline exists because the aquifer is being drawn down faster than it recharges, and the city committed to it in 2021, before Project Cardinal existed. [9b] Whether a large industrial customer then raises or lowers residential rates depends on the industrial tariff, how fixed costs are allocated, and whether serving the load takes capacity the pipeline was not already sized for. Yorkville has published no cost-of-service study, so this article explains the mechanism, not a direction. Newton County shows it can run the wrong way: Mansfield’s mayor told the Times that rates there are set to rise 33% over two years alongside data center growth. [29] The record does show that Yorkville charges data centers connection fees for a share of Lake Michigan supply, storage, and backup well costs: about $3.58 million for Project Cardinal and $1.98 million for Project Steel. [11r]
Claim: QTS secretly tapped Fayette County’s water. Tier: Misattributed. A metering failure reported as an unauthorized connection.
QTS’s 615-acre campus in Fayette County, Georgia drew water through two connections that went unbilled for an estimated four to fifteen months, depending on whether the estimate comes from the county or the company, until residents complaining about low pressure surfaced the gap. The county billed nearly $150,000 for more than 29 million gallons, and QTS paid. [13] The “unauthorized connection” framing came from the county’s own May 2025 letter, which said one connection was installed “without the knowledge or inspection” of staff. County administrators later said a missed meter reading during the county’s transition of about 33,000 meters to a new metering system caused it, and that staff had inspected the installation. [13a] In May 2026, the county conceded its letter “was unclear.” [13b] The water system director’s description of QTS is the part that bears on enforcement: “They’re our largest customer, and we have to be partners.” [13] The record does not show whether that posture changed any decision; the county billed the full amount, and QTS paid it.
Water Quality
Water quality and water supply are different concerns. Volume is one question. Contamination is another.
Claim: Data centers contaminated wells in Oregon. Tier: Contested. One defendant among 17; causation unproven.
Amazon is one of 17 defendants in Pearson v. Port of Morrow, a February 2024 federal suit by Morrow County residents whose wells are contaminated with nitrate; the other named defendants include the Port of Morrow, food processors, farms, and Portland General Electric. The contamination traces to nitrogen-rich wastewater the port collects from food processors and data centers and sends to area farms, where it has been overapplied for years. The alleged pathway to Amazon runs through that system: the port’s nitrate-bearing wastewater cools Amazon’s servers, evaporation concentrates the nitrate, and the water goes back out to the same fields. [12] The cooling step concentrates nitrate already in the water rather than introducing it. This is an industrial wastewater case with a data center operator as one alleged contributor, not a case establishing that data center cooling contaminates aquifers on its own. Amazon denies contributing and says the region’s groundwater problems predate its data centers. In March 2026 it agreed to pay $20.5 million to settle with the plaintiffs, without admitting liability, and the case continues against the other defendants. [12]
Claim: Meta’s construction ruined its neighbors’ wells. Tier: Contested. Causation unresolved and now in court.
Beverly and Jeff Morris, whose home sits roughly 1,000 feet from Meta’s Stanton Springs campus in Newton and Morgan counties, Georgia, reported well failures beginning within months of construction starting in 2018: sediment that damaged appliances, pressure reduced to a trickle, and parts of the house without water. They have spent about $5,000 and cannot afford the roughly $25,000 a new well would cost. Reporting through spring 2026 described problems at a handful of nearby homes, not across the county. [29][10a] In late August 2026 the Morrises and three other families sued Meta and the Joint Development Authority, alleging that clearing, blasting, and excavation disturbed the aquifer and sent sediment into their wells. [29b] The Authority has acknowledged it did no well-water study before construction and called the cause unknown. [29a]
Meta says a consultant’s groundwater study found no impact: by its account the Morris property sits in a separate watershed, groundwater flows away from the plaintiffs, blasting was limited and more than a mile away, and the campus draws utility water, not groundwater. [29][29b][29c] Georgia’s own maps put the campus on a groundwater recharge area, the class the state treats as most vulnerable to surface activity. [29c] After a May 2026 congressional hearing, EPA had regional staff gather facts and said plainly that this “is not the same as opening a formal investigation”; a later unsigned EPA letter said neither EPA nor Georgia regulates private wells. [29][29b]
Whatever the court finds on cause, the case documents a gap in the framework. The construction stormwater permit that governed the site requires erosion and sediment controls and allows certain dewatering discharges, and it was not written to catch a disrupted private well; no federal standard requires a pre-construction well test that would give a neighbor a record to compare against. [30]
Claim: Data centers contaminate groundwater. Tier: Selective.
Groundwater contamination from normal operations at compliant data centers is not supported by published evidence. The plausible mechanisms, fuel storage, construction dewatering, and cooling discharge, exist at warehouses, manufacturing plants, and hospitals too, and nobody has published a comparison showing data centers differ on them, including this article. That is a reason to ask the same questions of every large facility, not a finding that the risk is identical.
Cooling Wastewater
Every evaporative cooling system produces a waste stream, and the water-use debate almost never mentions it.
Claim: Evaporative data centers send a chemical wastewater stream to the sewer, and no rule was written for it. Tier: Systemic.
A cooling tower rejects heat by evaporating water. Evaporation leaves the dissolved minerals behind, so operators bleed off part of the concentrated water and replace it with makeup water. That bleed is blowdown. In EPA’s water balance, makeup equals evaporation plus blowdown, and cycles of concentration is makeup divided by blowdown: at three cycles, one of every three gallons of makeup leaves as blowdown and two evaporate; at six cycles, one in six. EPA puts the savings from three cycles to six at about 20% of total water use. [12b] The same arithmetic cuts the other way: fewer gallons of wastewater, each more concentrated.
The Congressional Research Service’s July 2026 report lists what that stream carries: dissolved solids concentrated from the source water, chlorine, corrosion inhibitors, biocides, and copper, nickel, and chromium from pipe corrosion, with pH and temperature regulated in their own right and some treatment chemistry kept proprietary. Closed-loop systems discharge less in normal operation, but both kinds generate wastewater during maintenance, construction, and commissioning, and those flushes can reach a treatment plant as high-volume slug loads that pass through it or upset it. [12a]
Most data centers send that stream to the local sanitary district, which makes them indirect dischargers under the National Pretreatment Program. “EPA has not established ELGs for data centers, so categorical pretreatment standards do not apply.” [12a] Effluent limitations guidelines are the industry-specific numeric standards EPA writes for categories like steam power plants and steel mills. What remains is the general rule for every indirect discharger: nothing that interferes with the plant or passes through it into the river in amounts that violate the plant’s own discharge permit, no discharge below pH 5.0 unless the plant is designed to accept it, nothing that pushes plant influent above 104°F, and the local limits each plant writes to enforce those prohibitions. [12f] Those rules protect the plant and, through its permit, the receiving water. What they are not is a standard written for what a cooling tower sends to the sewer.
Whether a data center gets the closer oversight a large industrial discharger normally gets is a classification question. Illinois’s 25,000-gallon-a-day test for a significant user counts process wastewater and excludes “sanitary, noncontact cooling, and boiler blowdown wastewater”; a process stream of 5% or more of the plant’s dry-weather capacity also qualifies, and the control authority can designate a user regardless. [12c] The rule does not say how a district must classify evaporative cooling tower blowdown, which carries the treatment chemistry listed above; a district can count it as process wastewater. [12c] CRS reports, as a national generalization, that data centers are not typically classified as significant users because blowdown is excluded from the flow count. [12a] I found no Illinois district determination either way, so an applicant should get the district’s classification in writing. Ohio is the one state I found that drafted a statewide data center permit, and it covered a different pathway: direct discharge to surface water, not the sewer. Circle of Blue reported in July 2026 that Ohio EPA had dropped the draft after more than 7,000 comments. [12d][12e]
Claim: Cooling tower blowdown is a uniquely toxic data center discharge. Tier: Selective.
The chemistry is the same at any building that cools with a tower, and EPA’s water-efficiency guidance describes the same water balance and blowdown for hospitals, office towers, and plants that send it to the same sanitary districts. [12b] What differs at a hyperscale campus is the volume at one site, and no source I located publishes facility-level blowdown volumes, so that is a number the applicant has to supply. [12a] Air-cooled closed-loop designs produce little routine blowdown, which is the wastewater side of the trade described in the water supply section. In Yorkville, the sanitary district’s director told his board in February 2026 that the projects’ cooling “now will not use water” and that they “will only discharge sanitary waste,” while noting the district “has still not received any plans.” [11p] On that account the open wastewater question there is construction and commissioning discharge, not routine blowdown. [12a]
Noise
Claim: Data centers are loud. Tier: Regional. Depends on cooling design, climate, and distance.
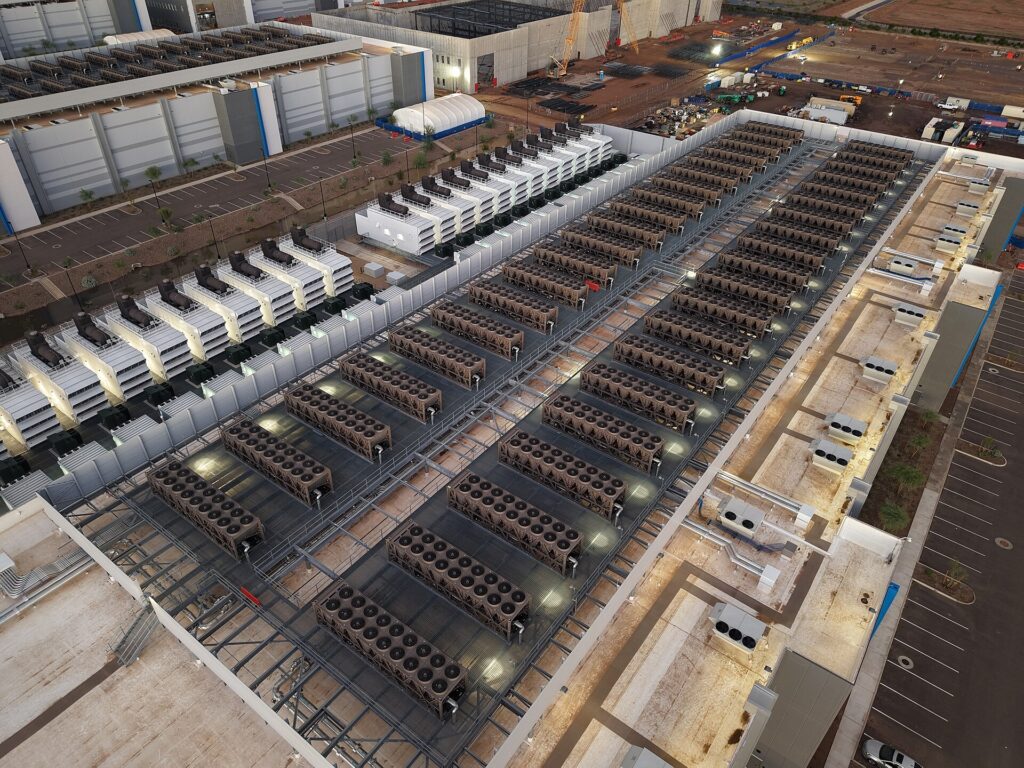
Virginia’s JLARC study, the only state-level examination of the question I located, found that “a large majority of data centers do not generate noise complaints because of their location or design,” that whether noise carries past the property line depends on design and cooling type, and that the noise behind resident complaints measured roughly 40 to 59 decibels, “rarely loud enough to violate noise ordinances.” The complaint is the constancy, not the volume. [4] Complaint counts are not measurements, so the finding supports something narrower than “data centers are quiet”: complaint-level noise is not inevitable. DeKalb’s city manager said in August 2026 the city has had no complaints about noise or any other pollution from Meta’s campus, roughly a mile from the nearest homes. [10d] Air-cooled facilities run fans continuously, and in hot climates they run at or near full speed for long stretches. Variable-speed fans, barriers, berms, and setbacks in the hundreds of feet are available mitigations, and I found no survey of how widely they are deployed. One vendor reports a 97.5% reduction in tonal fan noise from impeller redesign, a result it published itself rather than one independently verified. [14]
Claim: Chandler shows data centers make neighborhoods unlivable, and Chandler is coming to Yorkville. Tier: Misattributed.
Chandler’s noise problem was real. In early 2019, residents near Dobson and Queen Creek roads described the hum from a CyrusOne campus’s 24 chillers as “a blender on steroids,” and one said she had not slept a full night in about two and a half years. CyrusOne said it complied with the city’s ordinances. [36b] The cause was a zoning framework with no data center provisions applied to a facility of this scale near homes: city staff later wrote that the lack of rules “has caused confusion for both the data center industry and Chandler residents,” and the council adopted a data center zoning amendment, Ordinance No. 5033, in December 2022. It sets no decibel limit. It requires a third-party sound study at the nearest residential property line before the first neighborhood meeting, mitigation so operation does not exceed the ambient level that study found, post-construction studies at peak operation annually for five years, an on-site liaison for noise complaints, and generator testing on weekdays between 9 a.m. and 5 p.m. with 24 hours’ public notice. [36a] That is a siting failure answered with a measurement, not a property of the building type.
Carrying it to Yorkville also skips the climate. Northern Illinois has far more cool-weather hours than Phoenix, which changes the cooling load and the fan speed for much of the year, though the economizer inputs that would quantify it are not public for any proposal here. It does not settle Yorkville the other way: Project Steel is air-cooled, and an air-cooled campus here still runs at full output on hot, humid days. Chandler’s record cannot stand in for design-day sound levels at a Yorkville property line. Only the applicant’s acoustic data can.
Claim: Neighbors “are not going to hear this campus.” Tier: Contested. A promise the conditions will test.
This is the developer’s claim, made under oath by Project Cardinal’s representative at the July 2025 hearing: “They are not going to hear it during operation, they are not going to hear it during generator testing.” [11y] The neighboring project’s own consultant shows why that needs measuring. Prologis’s study for Project Steel measured average baseline (L90) levels of 39 to 42 dBA and found the base design would put 49 to 65 dBA on nearby homes, over both the city code and the state limits that govern the unincorporated residences around the site. [11d] Quieter chillers and sound walls bring it within the city’s 60 dBA day and 50 dBA night limits; for the state’s roughly 44 dBA nighttime limit, the study claims only “substantial compliance,” and only with the lowest-noise equipment. [11d][11s] Those state limits are the Illinois Pollution Control Board’s octave-band ceilings for sound crossing onto residential land, such as 61 dB at 63 Hz and 35 dB at 1,000 Hz by night from a commercial source; they apply everywhere in Illinois, including where no city ordinance reaches, and they are enforced by complaint after the fact. [41a] CyrusOne’s study for its 228-acre Yorkville campus projected 30 to 45 dBA at nearby homes at night against background levels of 38 to 41 dBA: within code, and at the top of that range, above the existing background. [11q] And CyrusOne’s older Aurora campus, approved around 2017, drew enough complaints, mainly about rooftop fans, that Aurora wrote new rules. [11q][11t][11u]
Yorkville wrote the test into the approvals. Steel’s agreement puts city-chosen continuous monitors in at the start of each construction phase for the life of the project, sets the city code with a 10 dBA penalty for tonal noise as the limit, requires mitigation on any exceedance, and requires the final study to use measured sound data for the actual equipment. [11s] CyrusOne’s amended agreement requires continuous monitoring and a reviewed noise study with each building permit, and records that the city’s ordinance exempts emergency generator operation. [11q] Cardinal’s carries continuous monitoring and a report within 60 days of each building going live. [11x] Whether neighbors hear these campuses will be a measured fact, which is the point.
Claim: A data center this size “could cause significant noise pollution in this area to residents, causing neurological and mental health stressors in addition to medical issues and complications.” Tier: Contested.
That is the Yorkville resident’s March 2025 claim, supported with general material on noise and diesel exhaust rather than anything about this site. [11w] The measurable question is the level and duration of sound at the home, which the Yorkville conditions now require someone to measure. Whether a given level at a given home harms health is not something the sources reviewed for this article settle, and it is not something a general article about noise can settle for a specific campus either.
Claim: Data centers harm health through infrasound you can’t hear. Tier: Fabricated.
The claim is that facilities emit sound below 20 Hz, below the threshold of hearing, that causes headaches, insomnia, nausea, and anxiety through an inaudible mechanism. The mechanism is where it fails. Infrasound becomes audible at high levels, about 97 dB at 10 Hz and 107 dB at 4 Hz for a typical young adult [32a], and a review of the literature found “no reliable evidence that infrasounds below the hearing threshold produce physiological or psychological effects.” [32a] I found no facility-specific measurement showing sub-20 Hz levels anywhere near the hearing threshold at a residential setback. A 2019 NIOSH health hazard evaluation, citing a 1982 review, reported no evidence of hearing threshold shifts from continuous exposure at 118 dB or less for 24 hours. [32]
The closest population evidence comes from wind turbines, and it is comparison evidence only: turbines are a different source, and the study related health outcomes to calculated turbine noise levels, not to infrasound measured on its own. Health Canada’s study of 1,238 households near 399 turbines, published in peer-reviewed form in 2016, found self-reported illness, including migraines, tinnitus, dizziness, and poor sleep, unrelated to calculated turbine noise, and found the objectively measured outcomes, hair cortisol, blood pressure, resting heart rate, and actigraph-measured sleep, unrelated to it as well. Annoyance did rise with exposure: each 5 dB increase raised the odds of being highly annoyed by a factor of 2.6. [31][31a] Residents raising infrasound are usually responding to something real, audible low-frequency noise or the fair worry that a decibel reading misses something. That is answered with octave-band measurements before and after construction, not with the infrasound claim.
Construction
Claim: Building a data center disrupts the neighborhood for years. Tier: Systemic.
Construction is the impact residents encounter first, experience longest, and raise most often at hearings, and the pattern repeats across states. In Saline Township, Michigan, gravel haulers serving the Oracle and OpenAI campus drew complaints about speeding, noise, dust, and damage to newly repaved streets. [37] Near Microsoft’s Mount Pleasant, Wisconsin campus, neighbors reported construction noise, dust, light, and truck traffic through successive build phases. [38] In Middlesex Township, Pennsylvania, residents reported a blast that shook a house across the road, despite pre-blast surveys and seismographs. [39] A Louisa County, Virginia homeowner sued Amazon in July 2026 over dump truck traffic, dust, and water discoloration. [40] In Spartanburg County, South Carolina, residents said tree clearing removed a sound buffer that had shielded them from existing noise. [41] Dust behaves the same in Illinois as in Michigan, and a loaded gravel truck weighs the same on Eldamain Road.
Duration is what changes the experience, and it attaches to large phased campuses of any kind, of which hyperscale data centers are one. Project Cardinal’s agreement describes a build-out of about ten years and calls the phasing plan “advisory only and non-binding.” [11x] Mount Pleasant residents are living beside phase three. The “temporary disruption” framing assumes an end date phased campuses do not offer. Yorkville’s settlement with a resident in the first Cardinal lawsuit, approved 5-1 on June 23, 2026, requires each construction phase to be substantially complete before the next begins, with exceptions for circumstances beyond the developer’s control. [11o][11k]
Claim: Haul trucks and dust are a data center problem. Tier: Selective.
Haul traffic, dust, and construction noise come with any large project, and warehouses, hospitals, subdivisions, and highway rebuilds are rarely treated as environmental questions for it. Blasting, well damage, and clearing an established tree buffer are site-specific and do not happen everywhere. Apart from those and the duration, most of the construction complaint is a large-project complaint.
Claim: Living next to a data center means dust and trucks. Tier: Misattributed.
Dust, haul traffic, and blasting end when construction ends. Describing them as what an operating data center is like conflates a build phase with a facility. On a ten-year campus the distinction is thin for the neighbor, which is why phasing conditions matter more here than anywhere else in this article.
Thermal Effects
Claim: Data centers heat the air around them. Tier: Regional. Documented at air-cooled facilities in Phoenix.
Air-cooled data centers in Phoenix measurably warm the air downwind, by up to 4°F (2.2°C) in summer. A peer-reviewed Arizona State University study measured ambient air temperature at four Phoenix-area facilities from June through October 2025 with vehicle-mounted sensors driven simultaneously upwind and downwind. Average downwind increases ran 1.3 to 1.6°F, detectable up to about a third of a mile from the perimeter. It is the first study to measure air temperature directly rather than satellite-derived land surface temperature. [14a]
Claim: AI data centers raise temperatures 2°C for miles around. Tier: Contested. A satellite preprint, not peer reviewed.
A preprint first posted to arXiv in March 2026 (Marinoni et al.) reports that satellite-measured land surface temperature rises about 2°C on average after an AI data center starts operating, with effects detectable up to 10 km away and an average 1°C increase out to 4.5 km, and estimates that more than 340 million people could be affected. [14b] It measures ground surface temperature, not the air people experience. The authors say they filtered out seasonality and “other types of anthropogenic activities,” but the paper does not describe a control for the facility’s own conversion of fields to roofs and pavement, which by itself raises satellite-measured surface temperature and is already in place when operations start. [14b][21] The result may be real, overstated, or largely an artifact of construction, and the method as described cannot tell which.
Claim: A data center will create a heat island here. Tier: Contested. Unstudied in a cold climate, not shown absent.
The Yorkville projects moved to air cooling to cut water use, so the corridor uses the design the ASU study measured. What differs is the climate. Whether a 4°F downwind effect measured in a Phoenix summer appears at all in an Illinois July has not been studied, and no published evidence supports predicting a neighborhood heat island here.
Land and Habitat
Claim: Data centers are taking our farmland. Tier: Systemic.
True, and permanent. Data centers in Northern Illinois are typically sited on agricultural land, with corn and soybeans the dominant prior use. The decision in front of most councils is therefore whether to rezone farmland for industry at all, and that is a values question about land, not a finding about data centers. Where the alternative is continued agriculture, the questions that matter are prime farmland loss, drainage district and field tile disruption, impervious cover, detention basin maintenance, and post-construction stormwater performance. Those deserve their own treatment and do not get it here.
Claim: A data center is the worst thing you could put on this land. Tier: Selective.
Where a parcel is already industrial or certain to be, the comparison is another industrial use, and the record does not support ranking data centers worst. A warehouse distribution campus generates its own footprint: heavy truck traffic, disproportionately at night, diesel particulate at loading docks, and refrigeration noise. [33a] No controlled study has measured the two uses against each other on matched parcels. On known characteristics they differ in kind: a data center’s operating impacts are continuous and mechanical, a warehouse’s vehicular and peak-driven, and which a neighbor would rather live beside depends on what that neighbor is sensitive to. A council weighing a parcel can fairly ask what use or site would be acceptable. If the answer is none, the objection is to the building or to a constraint every local site shares, such as transmission, water, or residential proximity, and each is legitimate argued as what it is.
The Cardinal approval shows what conditions on the land can look like. The PUD agreement approved November 10, 2025 carries a 100-foot landscape buffer on all four road frontages with a 12-foot berm facing homes and 8 feet elsewhere, a 500-foot separation from any home or business occupied on the approval date, and a 78-foot height limit including rooftop equipment. [11x] Shaw Local’s account adds 4,900 new trees and setbacks of 625 and 1,200 feet from the two nearest subdivisions, from the plan exhibits. [11m] The record I located has no stormwater performance data and no measure of net habitat outcome.
Light Pollution: Wildlife and Habitat
Claim: Data center lighting harms wildlife. Tier: Systemic. True of any large facility lit through the night.
Artificial light at night disrupts migratory bird navigation, suppresses insect abundance, alters predator-prey timing, and interferes with pollination, and the peer-reviewed literature on it is substantial. [25] Any large 24-hour campus lit to commercial standards produces the effect, and it matters most near flyways and sensitive habitat. It is addressable with Dark Sky-compliant specifications, full-cutoff fixtures, and motion-activated lighting on non-security perimeters. Cardinal’s developer testified that its lighting would “exceed dark sky standards”; the agreement requires a photometric plan with each building permit. [11y][11x]
Claim: Data center lighting is uniquely harmful. Tier: Selective.
The same mechanism applies to warehouse campuses, 24-hour plants, highway interchanges, and big-box retail. In the opposition material I have reviewed, the objection is not applied to them.
Light Pollution: Human Health
The mechanism is established physiology. Artificial light at night suppresses melatonin and disrupts circadian rhythm. The International Agency for Research on Cancer classified shift work involving circadian disruption as probably carcinogenic to humans (Group 2A) in 2007, confirmed in 2010 and 2020. [26] The American Medical Association’s 2016 policy on high-intensity LED street lighting found brighter residential nighttime lighting associated with reduced sleep, impaired daytime functioning, and obesity. [27] Epidemiological reviews find associations between outdoor light at night and breast cancer, type 2 diabetes, cardiovascular disease, and depression in large cohorts. [28] The claims built on that mechanism are what get tiered.
Claim: The health studies show what living near a lit data center does to you. Tier: Exaggerated. Occupational and regional exposure applied to a single facility.
The literature draws on two populations: night shift workers under high-intensity light for long hours, and whole metropolitan populations correlated with satellite-measured light across regions. Neither describes a resident at a setback from one facility. Direct light falls off roughly with the square of distance, though skyglow and reflected light do not. The AMA grounds its concern in intensity, spectrum, duration, and timing, and the Illuminating Engineering Society, which disputes the AMA’s use of color temperature as a proxy, argues that the quantity of light reaching the eye and the duration matter at least as much. [27][27a] Every side of that professional dispute treats dose as decisive. A full-cutoff fixture at a 500-foot setback is not a night shift under overhead lighting.
Claim: Data center lighting is a health risk other lit buildings aren’t. Tier: Selective.
A three-shift warehouse lights comparable or greater exterior acreage, and the mechanism applies identically. In the opposition material I have reviewed, the objection does not.
Claim: This facility’s lights will cause cancer in its neighbors. Tier: Contested.
The population studies measure aggregate light across neighborhoods, not one facility’s contribution to one bedroom, and an NCI epidemiologist writing in the British Journal of Cancer has noted that mixed findings are hard to interpret because individual exposure assessment is unresolved. [28a] I found no peer-reviewed study that measured health outcomes attributable to light from a single industrial facility. There is also no federal standard for residential light exposure from adjacent industry and no established safe threshold. Those are real gaps. Neither establishes harm at any specific facility.
Chemical Hazards
Claim: Data centers will contaminate groundwater with PFAS from firefighting foam. Tier: Regional. Sites where foam was tested or discharged.
Aqueous film-forming foam (AFFF) is the documented concern. Its per- and polyfluoroalkyl substances (PFAS) are associated with groundwater contamination where suppression systems were tested or discharged, and PFOA and PFOS are CERCLA hazardous substances. [15a] Their federal drinking water limits of 4 parts per trillion remain in place; EPA’s May 2026 proposals would keep them, let systems that request it take until 2031 to comply, and rescind the limits for four other PFAS; neither is final. [15d] Two distinctions keep the concern from being misapplied. AFFF is a foam for flammable-liquid fires, which at a data center means the fuel and generator yard, not the data hall. The clean-agent gases common in data halls, FK-5-1-12 and HFC-227ea, are not foams and do not reach groundwater the way foam does, but they are PFAS under some definitions, though not under CERCLA, so “PFAS-free” is a claim to check against the agent named in the fire protection plan. As of May 2025, fifteen states, Illinois among them, had banned the sale of PFAS-containing firefighting foam. [15b] Operators describe a transition to fluorine-free agents, and there is no public, independently verified timeline for completing it. The industry has not published one. That is an accountability failure.
Claim: Immersion cooling fluids are a new toxic risk. Tier: Contested.
Immersion cooling submerges servers in non-conductive dielectric fluid and is growing in high-density AI facilities. I found no peer-reviewed lifecycle environmental data for these fluids at commercial scale. The concern is plausible and undocumented, which is why an application for an immersion-cooled facility should name the fluid, the volume on site, the containment, and the disposal route.
Claim: Data centers are a fire hazard to the neighborhood. Tier: Contested.
Battery systems at data center campuses are typically installed to NFPA 855, which binds where a jurisdiction has adopted it, and tested against UL 9540A, a method for evaluating thermal-runaway propagation. [16a] Fire is a real event class wherever dense electrical equipment runs. Uptime Institute’s annual outage analyses find power supply, not fire, the leading cause of significant outages, but outage data does not count fires that did not interrupt service. [16] Settling the question would take insurer, fire department, or NFPA incident data, and I found no industry-wide fire dataset. Cardinal’s agreement puts battery storage other than in-rack backup in standalone buildings at least 50 feet from other structures, with a fire safety plan approved by the fire district. [11x]
Electromagnetic Fields
Claim: The data center will expose neighbors to dangerous EMF. Tier: Selective. The source is power infrastructure, not the data center.
Fiber carries no power-frequency current, and network copper carries signal current at low power. The 60 Hz fields come from the substations, transformers, switchgear, and high-current conductors that serve any large load: a plant, a hospital, a distribution center, or the substation serving a subdivision. [34]
Claim: Power-line EMF causes cancer. The reverse claim: EMF concerns are made up. Tier for both: Contested.
IARC classified extremely low frequency magnetic fields as possibly carcinogenic (Group 2B) in 2002, based on associations between long-term residential exposure and childhood leukemia. [35] ICNIRP’s 2010 guidelines set public reference levels at 2,000 milligauss to prevent acute nerve stimulation, not from a risk assessment of long-term low-level exposure. ICNIRP calls the leukemia evidence “too weak to form the basis for exposure guidelines” while acknowledging pooled analyses that “indicate that an excess risk may exist for average exposures exceeding 0.3 to 0.4 µT,” 3 to 4 milligauss, about three orders of magnitude below the reference level; WHO says the evidence is not strong enough to be considered causal. [34][35a] The United States has no federal limit. Six states set numeric limits for power-line fields and five apply “prudent avoidance”; Illinois was in neither group in the 2018 international comparison, which covers statewide standards, not conditions the Illinois Commerce Commission may attach to a siting order. [36] The signal exists, the standards were not built to address it, and none of it is specific to data centers. Calling it fabricated overstates the case against it as much as calling it proven overstates the case for it.
Where the Industry Is Wrong
The NDAs are the most corrosive practice. University of Mary Washington researchers found 25 of 31 Virginia local governments with an identifiable data center operating under a nondisclosure agreement, a figure Senator Blumenthal cited in March 2026 when he asked utility regulators in all 50 states for any data center NDAs they hold. [18b] Wisconsin Watch documented NDAs in at least four Wisconsin communities, two of them with a shell company that kept the operator’s name hidden. [17a] Microsoft said in March 2026 it would stop signing NDAs with local governments and work to end existing ones, while still protecting trade secrets submitted for permits where the law allows. [17] Amazon followed in October 2026: “We no longer use nondisclosure agreements with the government agencies we work with on our projects.” That applies to new agreements and does not address shell companies and codenames. [17b] I found no comparable announcement from Google, Meta, or Oracle. Using legal agreements to keep elected officials from telling constituents what they are approving is not compatible with claiming to welcome community oversight.
“100% renewable” as marketed is an accounting claim, not a physical one. Annual certificate matching means the operator bought certificates equal to its annual consumption, not that renewable generation supplies the facility hour by hour. On most grids, fossil units run during some of the hours the facility draws power.
“Water positive” has the same gap. Microsoft says it reached water positive in 2025, replenishing more water globally than it withdrew; I found no third-party audit of that. [23a] Amazon reports it was 75% of the way to its data center goal in 2025, and Google reports replenishing 64% of its freshwater consumption in 2024. [23c][9] The problem is the mechanism. As a former Amazon water sustainability manager has put it, water does not offset like carbon: water replenished in one watershed does nothing for the watershed a specific facility draws from. [23b] A company-wide figure can be true while the aquifer under a specific proposal gets no benefit, and the aquifer is what a community is deciding about.
The allegations against xAI describe the same conduct at two facilities in two states. I found no public formal statement from major industry trade organizations condemning it.
Where the Opposition Is Wrong
The opposition’s best-known health estimate modeled a permit ceiling, and the regulator’s rebuttal disclaimed the expertise to answer the health question. In early 2026 the Piedmont Environmental Council commissioned an air quality and health analysis of Vantage’s VA2 campus in Sterling, Virginia, the facility whose generators later ran for nearly a day in July. VA2 is not a typical data center: it runs eight natural gas turbines as primary power, with 42 diesel engines for emergencies, under a minor-source permit in an ozone nonattainment area, and Vantage has told DEQ it plans to shut the turbines down once grid upgrades allow. [19a] The report, by EmPower Analytics Group (Michael Cork and Francesca Dominici), dated February 27 and released March 4, 2026, says it “reflects operation at the facility’s maximum permitted annual emission limits” and “does not attempt to predict typical operating conditions.” On that bounding scenario it estimated $53 million to $99 million a year in health damages and 3.4 to 6.5 additional premature deaths. [19b]
Virginia DEQ’s April 27, 2026 assessment made four points. Actual 2025 emissions ran 28% to 69% of permit limits, 47% for NOx. The report’s local air quality baseline came from 2023, a wildfire-smoke year; 2024 monitor data ran about 25% lower. Its dispersion model, InMAP, is not EPA-approved for this use and treated every turbine and engine as one aggregated source although each has its own stack and they do not all run at once; in one case DEQ could compare, InMAP overpredicted fine particulate by at least a factor of five. And COBRA, the screening tool used to convert emissions into health costs, is built for regional and national questions, which DEQ concluded overstated the estimates “by at least an order of magnitude and likely more.” [19a]
DEQ’s response has problems of its own. The assessment states DEQ “has no expertise in this field” of health impact calculation, and E&E News obtained emails in which staff said, “We aren’t qualified to do that review.” The emails show the director had the report about two days before its release, staff had a preliminary critique drafted less than three hours after publication, and the director wrote after receiving staff comments that PEC “wants to criticize DEQ.” [19a][19c] DEQ’s statement that Loudoun ranks among Virginia’s healthiest localities rests on health data through 2023, before the turbines began operating. [19a][19c] Cork told E&E News he reran his analysis on DEQ’s observed emissions and still estimated $33 million to $63 million a year in health damages and two to four premature deaths. Those are his figures as reported. Neither PEC nor EmPower has published the rerun, so its inputs and method cannot be checked, and DEQ’s model objections would still apply to it. [19c]
What survives is narrower than either side’s coverage. The report disclosed that it modeled a ceiling, but its headline numbers describe that ceiling, not the facility’s operation, and two screening tools built for broader questions compounded the overstatement on DEQ’s account. DEQ’s response is not an answer to the health question, because DEQ says it does not answer health questions. The question was legitimate, its first answer was a ceiling, and the rebuttal was not built to answer it. The facility also runs gas turbines around the clock, which makes it a poor stand-in for the backup-generator fleets the rest of the Virginia debate is about. DEQ’s new monitoring network adds local measurements; by itself it will not attribute readings to VA2, catch hotspots between monitors, or establish health effects. [19]
The VA2 dispute shows one opposition error, and only in how its numbers travel: headline damage figures that describe a ceiling, repeated without the ceiling. A bounding analysis is a legitimate tool when the question is what a permit allows. The other opposition errors this article documents are elsewhere. The infrasound mechanism has no evidentiary basis. Loudoun’s nonattainment conclusion does not transfer to an attainment county, and Phoenix’s water problem does not transfer to a depleting confined aquifer. The Yorkville resident’s health warning was built from general material on diesel exhaust and noise, none of it about this site, which makes it a question to measure rather than a finding. [11w] Each of those is checkable before a hearing, and each is how a real concern loses a room it should have won.
Where Regulators Are Wrong
Air permitting has almost no step that looks at a cluster. The Clean Air Act aggregates emissions units under common control on contiguous property, so a campus’s generators are evaluated together, and campuses commonly hold facility-wide permits structured to stay under major-source thresholds; VA2, with 42 diesel engines and eight turbines, holds a minor-source permit. [5b][19a] Prevention of Significant Deterioration review of a major source does require showing that its increase, with other increases in the area, will not cause or contribute to a standard violation. [5b] Minor and synthetic minor sources do not trigger that analysis, and separately controlled campuses are not aggregated as one source. Illinois has a partial exception outside its rules: under a February 2024 informal resolution agreement with USEPA, Illinois EPA posts a modeling memorandum with qualifying construction permits, and the Prime analysis modeled the area’s total 1-hour NO2, including nearby sources, not just Prime’s. [5j] Its test is whether the one project contributes significantly to a modeled exceedance. A single campus among many will rarely clear that bar, so the analysis sees the cluster without assigning it to anyone; that is my reading of the test, not a statement in the memo. Aggregation and cumulative assessment are different things: separately permitted sources can be modeled together without being treated as one. JLARC did put a number on Loudoun’s fleet, a worst case of over 9,000 tons of NOx, without modeling its air quality effect. [4] What I did not find, in Virginia’s or Illinois’s rules, is a step that puts that kind of analysis in front of the agency issuing the next permit. Loudoun’s permitting worked as written and permitted thousands of generators one decision at a time. Attainment monitoring is a check, but a retrospective one with coarse spacing. In 2026, federal emergency orders authorized starting those fleets together nine times; PJM has not yet done it. [5d][5i] The missing instrument, on this record, is a cumulative review trigger keyed to airshed loading below the major-source threshold. That is my conclusion from the record, not a finding any agency has made.
Beyond the Tier 4 generator rule, which reaches only data centers that need a federally enforceable state or Title V operating permit, Illinois’s other statewide environmental condition on data centers is attached to a tax break. A data center in the state’s investment program must certify within two years of being placed in service that it is carbon neutral or certified under a green building standard such as LEED, ENERGY STAR, or ISO 50001. [44] None of those standards limits generator emissions, water draw, or sound at a property line. The governor paused new agreements in the program effective July 1, 2026, citing energy affordability and water resources. [45] The pause changes what the state offers, not what any permit requires.
No federal rule standardizes water metering or public water-use reporting for data centers; Fayette County’s unbilled draw was caught by neighbors noticing pressure, not by any rule. [13][13a] Construction stormwater permits, federal or state, do not require a pre-construction test of neighboring private wells, and EPA’s answer in the Newton County case was that neither it nor Georgia regulates private wells. [30][29b]
In the jurisdictions I examined, pre-construction baselines for sound, air quality, and well water were not standard permit conditions, and I found no national survey showing how common they are. A baseline does not prove cause, but it makes every later attribution argument easier to settle, and it cannot be reconstructed after construction. Aurora and Chandler now require one locally, after disputes of their own. I found no national database of data center environmental incidents or complaints, and no systematic tracking of which facilities have completed the move away from PFAS foam. The cases in this article were chosen because something went wrong, so they show what the gaps look like when they matter, not how often they do.
Where Local Government Is Wrong
Local governments sign the NDAs. Developers present one as a condition of discussing a project, and a community that refuses risks losing it to a neighbor that signs, which makes it a structural problem the developers created rather than a failing of individual officials. [17][18b] The durable fix is developers dropping the term so every jurisdiction is on equal footing, which Microsoft and Amazon have now done. [17][17b] Until the rest do, an official bound by an NDA cannot fully tell constituents what a project entails. The same structure shows up in utility contracts. DeKalb’s 2020 water agreement for the Meta campus makes the campus’s actual consumption data confidential business information the city may not release without Meta’s consent, at Meta’s sole discretion, and exempts the campus from shortage restrictions unless critical public health requires them. [10b] Meta publishes an annual withdrawal figure for the site; [10c] the city that supplies the water cannot publish its own.
Most jurisdictions whose proceedings I reviewed evaluated data center proposals under zoning written for warehouses and industrial parks of a different character. A hyperscale data center draws roughly 50 to 200 permanent employees and exceeds 100 MW of electrical load, with recent facilities built at 100 to 1,000 MW. [33] The frameworks applied to it were not written for that, and where data center rules exist, a city wrote them, usually after a dispute somewhere.
Yorkville wrote its own while its first large proposals were pending, with other places’ disputes as source material. On June 24, 2025, by a 7-0 vote, the council adopted Ordinance 2025-53, data center standards its planner drew from Loudoun County, Prince William County, and Chandler. [11w][11b] As adopted and codified at Section 10-4-10 of the city’s Unified Development Ordinance, effective June 27, 2025, it requires a pre-construction noise baseline with modeling, a final study on measured data for the actual equipment, a mitigation plan, and either three years of annual monitoring by the city’s consultant or continuous monitors from the start of construction. [11b] It also set a 100-foot landscape buffer, a 500-foot separation from the nearest home or business, a 70-foot height limit within 1,500 feet of a home with rooftop units only by council approval, weekday daytime generator testing, phasing that starts farthest from homes, and a fire-district-approved emergency plan. [11w][11b]
Four and a half months later the council approved Project Cardinal’s PUD agreement. It applies the city noise ordinance “as it existed when the PUD application was approved,” vests the project’s entitlements for twenty years against later changes in city ordinances once the project starts within three years, and provides that no new or amended data center standards will apply unless the developer agrees in writing or state or federal law requires it. [11x] It describes Section 10-4-10 as “reserved for additional regulations applicable to Energy Industrial Uses,” though Ordinance 2025-53 had filled that section with the data center standards five months earlier, and it never mentions Ordinance 2025-53. [11x][11b] Much of the ordinance’s substance is in the agreement on its own terms: the 100-foot buffer, the 500-foot separation, the testing window, continuous noise monitoring, and a 50-foot battery setback. [11x] Where the two differ, the code caps height at 70 feet including rooftop equipment within 1,500 feet of a home and requires council approval for rooftop units [11b], while the agreement allows 78 feet including rooftop equipment and places mechanical equipment on rooftops whenever practical. [11x] The executed agreement, Ordinance 2025-77, carries the same freeze language as the version before the council. [11x] The freeze is the part that matters for the next decade. The agreement blocks new or amended city data center standards for twenty years unless the developer consents or state or federal law requires them; the city can still enforce the conditions already in the agreement, including the monitoring. [11x] A new standard written from what the city learns after November 2025, from its own monitors or from Aurora, will not reach Cardinal. On a campus that will be built over ten of those years, the scope of the freeze is a decision about which future rules the neighbors get.
Four and a half months later the council approved Project Steel on similar terms. Steel’s executed agreement, Ordinance 2026-32, carries the same twenty-year vesting and the same description of Section 10-4-10 as reserved, and adds that for fifteen years “any standards adopted to further regulate Energy Industrial Uses shall be waived and not applicable” to the site. Its noise terms, the continuous monitors and the measured final study, are in the executed text as they were in the packet. [11s]
Aurora shows the other path. After complaints around CyrusOne’s older campus, mainly about rooftop fans, it imposed a 180-day moratorium in September 2025 and on March 24, 2026 adopted the most detailed local data center rules I found in Illinois: conditional-use approval, a week-long baseline sound study filed with the petition, 57 dBA by day and 47 at night measured at the facility’s own property line, roof-mounted chillers at least 1,500 feet and ground equipment and generators at least 1,000 feet from homes, schools, and hospitals, rooftop generators banned, no evaporative chillers on potable water, and a design water usage effectiveness of no more than 0.2 liters per kilowatt-hour. Two rules reach existing data centers too: weekday daytime generator testing, two at a time, and annual energy, water, and property-line noise reports the city publishes. [11t][11u] Yorkville’s Cardinal agreement, approved four months earlier on its own consultants’ advice, says the opposite about placement: rooftops are “the most appropriate location for Mechanical Equipment.” [11x] Two neighboring cities, both advised by acoustic consultants, reached opposite conclusions about where the equipment belongs. Aurora wrote its rule after living next to the rooftop fans.
What to Require Before Approval
This section is the one part of the article not organized by complaint. It collects, in one place, what a council can ask for, each item tied to a case above or a term already in an Illinois approval. Two items have no documented failure behind them, off-site power infrastructure and end-of-life assurance, and are here because their absence from the approvals I reviewed is itself notable. None requires the applicant to concede anything about environmental impact.
Not all of it sits within municipal authority. Illinois EPA holds air permitting, and the Tier 4 generator standard is now a state permit condition [5c]; the Illinois Commerce Commission holds utility siting, and state law can preempt local conditions where the state has occupied the field. What a municipality generally controls is zoning, special use permits, annexation agreements, and development agreements. Attach conditions to the approval instrument, and have counsel confirm authority before a condition is negotiated rather than after. A condition a council cannot enforce is worse than none, because it looks like protection.
Measure first. Require a pre-construction acoustic baseline at the property line and at the nearest residences, an air quality baseline if the county is near a NAAQS threshold, and water testing of private wells within a defined radius. The public reporting on Chandler’s 2019 dispute cites no pre-construction ambient measurement to compare against, and the ordinance the city adopted afterward makes that measurement the first requirement. [36a][36b] The Morrises in Georgia have no pre-construction well record to compare against. These measurements can be taken before ground is broken and cannot be reconstructed afterward.
Ask what the whole corridor adds up to. Require an estimate of the combined generator fleet’s NOx contribution to the local airshed, counting facilities already approved, and a water demand projection against system capacity rather than current throughput. Loudoun County reached thousands of generators one correctly issued permit at a time. Yorkville’s corridor projection came from the city’s own engineer, funded by two of the developers, and no individual approval evaluates it.
Cap the resource, not the intent. A water cap with a billing-cycle average, a single-day ceiling, and financial penalties for exceeding either is enforceable in a way that a sustainability commitment is not. Yorkville negotiated exactly that. Require metered reporting to the utility on a schedule, since Fayette County’s gap was found by neighbors, not meters, and make the reports public; DeKalb’s agreement with Meta makes them confidential. [10b] If the parcel could support a private well, ask whether the agreement prohibits one, because the Water Use Act requires notice and registration for it but no state withdrawal permit. [9e] Rockford’s October 2026 staff draft, not yet adopted, shows the language: “No water well or sanitary sewer system will be constructed or used for the Data Center operations.” [9g]
Write the construction conditions into the approval. Designated haul routes avoiding residential streets and school zones. Delivery hour limits. A pre-construction road survey with developer-funded repair obligations. Dust suppression with a named enforcement contact. Pre-blast structural surveys with seismograph monitoring where blasting is planned. Phase-completion requirements, so a decade of building is not a decade of simultaneous activity. Saline Township negotiated traffic enforcement after the trucks started running, which is the wrong order.
Ask what the generators do in a grid emergency. Require the applicant to state the generator count, engine tier and aftertreatment, fuel storage, stack heights, and expected testing hours, and to say in writing how the campus will respond if PJM directs its backup generation to run under a DOE emergency order. Ask also how it would respond if its utility disconnected it from grid power under such an order, which is the step PJM asked DOE to allow and DOE has not written into an order. [5f] A development agreement that limits generators to testing should say what happens when federal direction conflicts with it, because Cardinal’s says its freeze on city standards yields “to the extent required by state or federal law.” [5d][11x]
Say what the agreement freezes. State in the approval instrument whether the city’s adopted data center standards bind the project, and decide deliberately which future rules a vesting clause should block. Cardinal’s agreement calls the section holding the June 2025 standards “reserved,” never says whether those standards apply, and freezes new standards for twenty years; Steel’s waives new data center standards for fifteen. [11x][11b][11s] A narrower freeze, one that exempts noise limits, monitoring, and generator operating rules, keeps the project’s land-use entitlements stable without locking out what the city learns from its own monitors.
Ask what moves when something improves. A facility that cuts water use by switching to air cooling raises electricity draw and fan noise. Require the applicant to state the cooling design and the resulting sound power levels, and to disclose changes to either after approval. Aurora’s ordinance shows the form: a design water usage effectiveness of no more than 0.2 liters per kilowatt-hour of IT load and a power usage effectiveness of no more than 1.2, both stated in the application and reported annually. [11t] Where a facility does use evaporative cooling, ask whether reclaimed water from the sanitary district can supply the makeup, which keeps potable water out of the tower; it does not remove the blowdown, since reclaimed water starts with more dissolved solids and concentrates the same way. A community that wins a water concession should know what it traded for it.
Ask where the blowdown goes. Ask the sanitary district, in writing, whether it counts tower blowdown as process wastewater. Require the cooling design, the planned cycles of concentration, the projected blowdown and commissioning discharge volumes, the receiving treatment plant or receiving water, and the full list of treatment additives including biocides. Get the treatment plant’s sign-off before approval, not after, since the sanitary district is often a separate unit of government from the council approving the project. Where the volume warrants, ask the treatment plant to designate the facility a significant industrial user, which Illinois rules allow it to do, and which brings the sampling and inspection that come with that status. [12c]
Specify lighting and fire suppression. Full-cutoff fixtures, Dark Sky-compliant specifications, and motion activation on non-security perimeter lighting. Fire suppression agents identified by name in the application, for the generator yard and the data halls separately, since “PFAS-free” means different things for a foam and a clean-agent gas and no public tracking exists of which facilities have completed the AFFF transition. [15b] The diesel tank schedule and the SPCC plan belong in the same submission. [15c]
Ask where the power comes from and what it requires. A campus at this scale rarely connects to existing distribution. It typically needs a new substation, switchyard, transmission upgrades, and easements, and those are sited and permitted separately, often by the utility and the Illinois Commerce Commission rather than by the municipality. The environmental and visual footprint of that infrastructure does not appear in the data center’s own application. Require the applicant to identify the interconnection plan and the associated off-site work at the time of approval, so the council is evaluating the whole project rather than the building.
Require an end-of-life plan and the money to execute it. Illinois already requires it of commercial solar and wind: state law makes a decommissioning plan and financial assurance a condition of county siting approval for those facilities, with the plan filed at application and the security posted before the building permit. [42] A jurisdiction that skips financial assurance can be left holding the cost when an operator leaves or fails. Data centers are permitted with no equivalent in the approvals I reviewed. The buildings are refit on multi-year hardware cycles, and whether a campus built for one generation of hardware suits the next is a question no approval I read asked. Require a decommissioning plan covering the buildings and on-site infrastructure: demolition, foundation and slab removal, restoration of pervious surface, and disposal of batteries, dielectric fluids, and fire suppression agents, with financial assurance sized to that plan and adjusted periodically. Off-site utility infrastructure is the utility’s to retire under its own tariff. This is the condition with the longest tail and the one least likely to be raised at the hearing where it matters.
Decline the NDA, and know what one can and cannot do. A jurisdiction that cannot tell residents what it is approving cannot represent them in approving it. Microsoft dropped the requirement in March 2026 and Amazon in October 2026, which removes the argument that declining costs the project with operators at that scale. [17][17b] The section above says why the durable fix is the developers’ to make rather than one council’s; a council that signs anyway should know that an NDA does not change what Illinois FOIA requires. The exemptions are the statute’s, not the contract’s. The one an NDA is built to invoke, for trade secrets and commercial or financial information furnished under a claim of confidentiality, requires the public body to show competitive harm from disclosure, and the burden of proving it rests on the public body, not the developer. [43] Ask for the operator’s name as well, since an NDA-free deal with a shell company discloses little.
Expect pushback on cost and timeline. A developer will say baseline studies delay the schedule, cumulative modeling is the state’s job, and a neighboring county will approve without any of it. The first two are negotiable and the third is often true. The cost of a baseline is knowable before approval; the cost of an unresolvable dispute is not. Chandler wrote its ordinance after the complaints, and Yorkville is in court over allegations that studies were not done. A council can sequence its asks, holding baselines and enforceable caps as non-negotiable and trading the rest.
Nothing here asks a developer to accept a claim about environmental harm. Each condition makes a future dispute answerable with a number instead of an argument, which is what both the industry and the opposition say they want.
What Nobody Knows
Each section above states its own evidence gaps. Six would change conclusions rather than sharpen them.
I found no controlled comparison of data center thermal, noise, or air quality impacts against comparably sized warehouses or plants on matched parcels, and none against continued agriculture where the decision is whether to rezone farmland at all.
I found no hourly marginal-emissions analysis for any proposed facility in a coal-heavy subregion or in Illinois. With the facility’s load profile and generator emission rates, it would settle whether on-site generation is cleaner or dirtier than grid service at a given site, a question both sides argue from averages.
No state or county rule I examined requires pre-construction baselines for sound, air, or well water; where acoustic baselines exist, in Yorkville, Aurora, and Chandler, a city wrote them, and no rule I found requires an air or private-well baseline. It is the unresolved item most fully within a local council’s power.
Whether construction blasting and excavation affect private wells at Newton County distances has not been studied systematically, which decides whether Newton County is an outlier or the first documented instance of a pattern.
No public dataset reports blowdown volumes or discharge chemistry for data centers, the number a sanitary district needs to size a pretreatment agreement. [12a]
PJM says it has not directed any data center backup fleet to run under the 2026 orders. [5i] What nobody has measured is what a simultaneous start would do at the nearest monitor. The first time PJM uses the authority, its notice to DOE and the run hours will be the record to request, and the monitor data for those hours will turn the question from a model into a measurement. [5h]
The Honest Accounting
The evidence does not support treating every data center proposal as environmentally equivalent. Impact varies too much by grid, geography, and design for a uniform position to track the facts. That is a claim about evidence, not about what a community should conclude. A community that weighs unresolved questions heavily, objects on cumulative rather than facility-by-facility grounds, or decides farmland is worth more than the tax base is making a values judgment this piece does not reach. The evidence also does not support the framing, voiced by some operators and trade representatives, that the concerns are largely invented. One claim rated here is fabricated. Most of the rest are real somewhere.
Sorting by complaint rather than by category is what makes that visible. Every category in this article holds complaints at more than one tier. The water category holds a real strain problem in Georgia, a misattributed import in Illinois, a superseded Yorkville figure, and a metering failure reported as a scandal. The noise category holds Chandler’s real siting failure, a developer’s untested promise, and a fabricated infrasound mechanism. A council that hears “data centers and water” or “data centers and noise” has heard a category, not a finding. The complaints that hold at compliant facilities everywhere are few: construction disruption, lighting’s effect on wildlife, farmland conversion, and the wastewater stream from evaporative cooling. Most of the rest turn on grid, climate, hydrology, design, or distance, and on whether the person making the claim has carried those conditions with it.
The failures documented here share a condition rather than a cause. Loudoun’s per-site air permitting, Fayette County’s meter migration, Chandler’s zoning map, and Georgia’s stormwater permit failed in different ways, and each was a framework written before the building type existed. These are the failures I found, not a sample; no one has compiled the denominator of approvals that went without incident. The imported claims share a pattern too: Virginia’s generators, Phoenix’s water, Oregon’s nitrate, Memphis’s turbines, and Georgia’s wells arrive in Illinois without the conditions that made them true, and the Yorkville record shows the developer reaching for Virginia as readily as the opposition, while the city borrowed rules, which is the legitimate kind of import.
What transfers to Illinois is not the harm but the gaps. I did not find cross-facility generator modeling, pre-construction well testing near construction sites, or pre-construction acoustic baselines as standing requirements in Illinois Administrative Code, in DeKalb or Kendall County ordinance, or in the state permits attached to the proposals reviewed here; Yorkville now requires measured noise studies and monitoring by agreement. Proving a requirement exists nowhere is beyond what a public-records search can settle. Attainment status removes the nonattainment review that applied in Loudoun County. The 2026 DOE orders, authorized nine times and unused so far, remove the comfort that the simultaneous-activation scenario is Virginia’s alone. And a twenty-year freeze on new city standards means the conditions a council writes after approval will not reach the project that prompted them unless the developer agrees. An attainment county answers the nonattainment part of the Virginia claim and nothing about engine count, dispatch, or whether the local process would catch a comparable problem before it happened. That question has a findable answer, from a council’s own counsel and permit engineer.
Before the next approval vote, have counsel and the city’s engineers put three things in the approval record: the baselines, measured before ground is broken; the corridor-wide estimates of generator emissions and water demand; and enforceable limits on water, noise, and generator operation that the vesting clause does not freeze. The next dispute then gets settled with a measurement.
Citations
[1] U.S. EPA, eGRID 2023 Summary Tables, initial release January 15, 2025; rev2 released June 12, 2025 (summary tables PDF internal production date March 27, 2025). https://www.epa.gov/system/files/documents/2025-06/summary_tables_rev2.pdf (archived: https://web.archive.org/web/20261025155941/https://www.epa.gov/system/files/documents/2025-06/summary_tables_rev2.pdf). Three-decimal subregion output emission rates (Annual NOx and SO2, lb/MWh) as published on EPA’s eGRID Summary Data page, “eGRID with 2023 Data”: https://www.epa.gov/egrid/summary-data (archived: https://web.archive.org/web/20261017013542/https://www.epa.gov/egrid/summary-data). Table 4, “State Resource Mix (eGRID2023),” Illinois: total net generation 177,690,287 MWh; nuclear 54.9%, gas 16.0%, coal 15.3%, wind 12.3%, solar 1.1%.
[1a] U.S. EPA, Power Profiler (eGRID 2023 data), subregion lookup by ZIP code and utility, read October 23, 2026. ZIP 60115 (DeKalb), 60178 (Sycamore), 60506 (Aurora), 61101 (Rockford), and 61068 (Rochelle) return RFCW; 61820 (Champaign), 62701 (Springfield), 61602 (Peoria), and 62002 (Alton) return SRMW; 61201 (Rock Island) returns MROW; 60560 (Yorkville) returns RFCW for Commonwealth Edison and SRMW for Ameren Illinois and Corn Belt Energy. https://www.epa.gov/egrid/power-profiler (archived: https://web.archive.org/web/20261025155519/https://www.epa.gov/egrid/power-profiler)
[3] Virginia Administrative Code 9VAC5-20-204, Nonattainment areas. https://law.lis.virginia.gov/admincode/title9/agency5/chapter20/section204/ (archived: https://web.archive.org/web/20260904211934/https://law.lis.virginia.gov/admincode/title9/agency5/chapter20/section204/). Federal designation: 40 CFR 81.347, Virginia, 2015 8-Hour Ozone NAAQS, “Washington, DC-MD-VA” Nonattainment, classification Moderate dated 11/7/2022, including Loudoun, Fairfax, Prince William, and Arlington counties. https://www.ecfr.gov/current/title-40/chapter-I/subchapter-C/part-81/subpart-C/section-81.347 (archived: https://web.archive.org/web/20250215131738/https://www.ecfr.gov/current/title-40/chapter-I/subchapter-C/part-81/subpart-C/section-81.347). Official annual edition, 40 CFR 81.347 (July 1, 2025): https://www.govinfo.gov/content/pkg/CFR-2025-title40-vol20/pdf/CFR-2025-title40-vol20-sec81-347.pdf (archived: https://web.archive.org/web/20261025190935/https://www.govinfo.gov/content/pkg/CFR-2025-title40-vol20/pdf/CFR-2025-title40-vol20-sec81-347.pdf)
[4] Joint Legislative Audit and Review Commission, “Data Centers in Virginia,” Report 598 (House/Senate Document RD206), December 9, 2024. Summary findings: generators “make up less than 4 percent of regional emissions of nitrogen oxides” in Northern Virginia (p. vi); “One-third of data centers are currently located near residential areas” (p. vii); “a large majority of data centers do not generate noise complaints because of their location or design” (p. viii). Chapter 5: 2023 actual emissions “only 7 percent of what permits allowed, with most emissions coming from maintenance testing”; emissions “unlikely to adversely affect regional air quality”; generators’ “intermittent use makes their impacts difficult to model”; regional monitoring “does not effectively capture localized effects”; DEQ three-year monitoring study (p. 59). “General Assembly could incentivize use of generators with lower emission rates”; Tier 4 engines or SCR reduce nitrogen oxides and particulate matter “reportedly by up to 90 percent”; “only one uses Tier 4 generators” (p. 60). Permits “issued per data center site, rather than per building or generator”; worst case “where all data centers in Northern Virginia reach their maximum allowed emissions” would emit “over 9,000 tons of nitrogen oxides in the region,” “about half of what has typically been emitted annually in Northern Virginia by all sources” (p. 60). Chapter 6: noise “is not loud enough to damage nearby residents’ hearing and rarely loud enough to violate noise ordinances”; audibility past the property line “depends on its design and its type of cooling system”; complaint noise “ranges from an estimated 40 to 59 decibels” (p. 75). “Almost one-third (29 percent) of operational data center properties in Virginia are within 200 feet of residentially zoned properties” (p. 77; Table B-1, p. 103). https://jlarc.virginia.gov/pdfs/reports/Rpt598.pdf (archived: https://web.archive.org/web/20261025155822/https://jlarc.virginia.gov/pdfs/reports/Rpt598.pdf). Legislative repository copy: https://rga.lis.virginia.gov/Published/2025/RD206 (archived: https://web.archive.org/web/20260908164522/https://rga.lis.virginia.gov/Published/2025/RD206)
[4a] Charles Paullin, Inside Climate News, “Virginia Regulators Weigh Expanded Use of Data Centers’ Polluting Generators,” republished by Virginia Mercury (December 16, 2025) and VPM (December 17, 2025). Reports “about 9,000 generators in Virginia, with about 4,700 in Loudoun County” without naming a source for the count; Julie Bolthouse, director of land use for the Piedmont Environmental Council, on Tier II share [advocacy source]; reports the JLARC worst-case figure now cited directly to [4], p. 60. https://virginiamercury.com/2025/12/16/virginia-regulators-weigh-expanded-use-of-data-centers-polluting-generators/ (archived: https://web.archive.org/web/20260824143656/https://virginiamercury.com/2025/12/16/virginia-regulators-weigh-expanded-use-of-data-centers-polluting-generators/)
[4b] Debbie Williams, Northern Virginia Magazine, “Sterling Resident Says Data Center’s Generators Produced Excessive Noise, Pollution,” July 21, 2026. Vantage VA2, Sterling: backup generators ran “almost 24 hours” on July 16 to 17, 2026, after a power failure, during regional wildfire-smoke air quality degradation; resident measurement of 60 decibels at the property line against Loudoun County’s 55-decibel nighttime limit; Virginia DEQ Director Michael Rolband’s reply that DEQ lacks “regulatory authority to stop these actions undertaken in response to the emergency.” https://northernvirginiamag.com/news/2026/07/21/sterling-resident-says-data-centers-generators-produced-excessive-noise-pollution/ (archived: https://web.archive.org/web/20261005093042/https://northernvirginiamag.com/news/2026/07/21/sterling-resident-says-data-centers-generators-produced-excessive-noise-pollution/)
[4c] James Jarvis, FFXnow, “Report: Fairfax County leads state in data centers near residential neighborhoods,” December 11, 2024. Reporting JLARC’s December 9, 2024 findings: nearly a third of Virginia’s data centers are within 200 feet of residential areas; county figures measured against residential zones (Fairfax 55% of 20 within 200 feet; Loudoun 24% of 71 within 200 feet and 34% within 500 feet). https://www.ffxnow.com/2024/12/11/report-fairfax-county-leads-state-in-data-centers-near-residential-neighborhoods/ (archived: https://web.archive.org/web/20261025155019/https://www.ffxnow.com/2024/12/11/report-fairfax-county-leads-state-in-data-centers-near-residential-neighborhoods/)
[4d] Kaela Roeder, Technical.ly, “Mapped: Data center permits show Northern Virginia generator concentration,” September 16, 2026. Analysis of 195 air permit applications: “more than 13,500 backup generators” at Virginia data centers, nearly half of them in Loudoun County. https://technical.ly/entrepreneurship/mapped-virginia-data-centers-thousands-of-backup-generators/ (archived: https://web.archive.org/web/20261025154833/https://technical.ly/entrepreneurship/mapped-virginia-data-centers-thousands-of-backup-generators/)
[4e] The Washington Post, “As data centers boom, Virginians breathe the exhaust of 10,000 diesel generators,” May 28, 2026. Analysis of state air permits and reported emissions for 132 Northern Virginia data centers through the end of 2024: 10,500 generators attached to data centers in Virginia. (Paywalled; figures confirmed through an excerpt.) https://www.washingtonpost.com/business/2026/05/28/data-centers-boom-virginians-breathe-exhaust-10000-diesel-generators/ (archived: https://web.archive.org/web/20260528194541/https://www.washingtonpost.com/business/2026/05/28/data-centers-boom-virginians-breathe-exhaust-10000-diesel-generators/)
[5] 40 CFR Part 60 Subpart IIII, Standards of Performance for Stationary Compression Ignition Internal Combustion Engines (criteria pollutant limits including NOx, applies at manufacture). Emergency engine hours at 40 CFR 60.4211(f): no time limit during emergencies (f)(1); up to 100 hours per calendar year for maintenance checks and readiness testing (f)(2); up to 50 hours per calendar year of non-emergency operation, counted toward the 100, with peak shaving and grid power sales prohibited except under the local-reliability dispatch conditions in (f)(3)(i). eCFR, https://www.ecfr.gov/current/title-40/chapter-I/subchapter-C/part-60/subpart-IIII/subject-group-ECFR7cc160b57a360ac/section-60.4211 (archived: https://web.archive.org/web/20260617111210/https://www.ecfr.gov/current/title-40/chapter-I/subchapter-C/part-60/subpart-IIII/subject-group-ECFR7cc160b57a360ac/section-60.4211). 40 CFR Part 63 Subpart ZZZZ, National Emissions Standards for Hazardous Air Pollutants for Stationary Reciprocating Internal Combustion Engines (RICE NESHAP), parallel emergency engine provisions at 40 CFR 63.6640(f). eCFR, https://www.ecfr.gov/current/title-40/chapter-I/subchapter-C/part-63/subpart-ZZZZ (archived: https://web.archive.org/web/20260713101544/https://www.ecfr.gov/current/title-40/chapter-I/subchapter-C/part-63/subpart-ZZZZ)
[5a] 40 CFR 81.314, Illinois designations, via eCFR (current as read October 23, 2026). 2015 8-Hour Ozone NAAQS: “Chicago, IL-IN-WI,” Nonattainment, classification Serious dated 1/16/2025, including “Kendall County (part): Oswego Township”; De Kalb County “Attainment/Unclassifiable.” DeKalb County “Unclassifiable/Attainment” for the 2012 Annual PM2.5 and 2006 24-Hour PM2.5 NAAQS and for NO2 (2010 1-Hour Standard). https://www.ecfr.gov/current/title-40/chapter-I/subchapter-C/part-81/subpart-C/section-81.314 (archived: https://web.archive.org/web/20261025162744/https://www.ecfr.gov/current/title-40/chapter-I/subchapter-C/part-81/subpart-C/section-81.314). Also U.S. EPA, Green Book, Illinois Nonattainment/Maintenance Status for Each County by Year for All Criteria Pollutants: https://www3.epa.gov/airquality/greenbook/anayo_il.html (archived: https://web.archive.org/web/20260825123608/https://www3.epa.gov/airquality/greenbook/anayo_il.html)
[5b] 40 CFR 51.165 (Nonattainment New Source Review) and 40 CFR 52.21 (Prevention of Significant Deterioration); Clean Air Act Section 182, 42 U.S.C. 7511a. PSD major source thresholds in attainment/unclassifiable areas are generally 100 to 250 tons per year depending on source category. Nonattainment NSR thresholds vary by pollutant and nonattainment classification and can run as low as 50, 25, or 10 tons per year for ozone precursors in more severe classifications. 40 CFR 51.165(a)(1)(iv)(A): major stationary source thresholds of “50 tons per year or more of nitrogen oxides in any serious nonattainment area for ozone” and “50 tons per year of Volatile organic compounds in any serious ozone nonattainment area”; 51.165(a)(9)(ii)(C): VOC offset ratio of at least 1.2:1 in any serious nonattainment area for ozone. https://www.ecfr.gov/current/title-40/chapter-I/subchapter-C/part-51/subpart-I/section-51.165 (archived: https://web.archive.org/web/20260614073844/https://www.ecfr.gov/current/title-40/chapter-I/subchapter-C/part-51/subpart-I/section-51.165). Both regimes aggregate emissions units under common control on contiguous or adjacent property as a single stationary source. https://www.epa.gov/nsr (archived: https://web.archive.org/web/20261025155400/https://www.epa.gov/nsr) and https://www.law.cornell.edu/uscode/text/42/7511a (archived: https://web.archive.org/web/20260615152932/https://www.law.cornell.edu/uscode/text/42/7511a) and https://www.ecfr.gov/current/title-40/chapter-I/subchapter-C/part-52/subpart-A/section-52.21 (archived: https://web.archive.org/web/20260712090245/https://www.ecfr.gov/current/title-40/chapter-I/subchapter-C/part-52/subpart-A/section-52.21)
[5c] Illinois Public Act 104-0458 (SB 25, 104th General Assembly), approved January 8, 2026, effective June 1, 2026, amending Section 39(a) of the Environmental Protection Act, 415 ILCS 5/39(a): each air pollution construction permit for diesel powered backup generators at a data center (as defined in 20 ILCS 605/605-1025(c)) “that is applied for 6 months after the effective date” and that requires a federally enforceable State operating permit or a Clean Air Act Permit Program permit shall require each backup generator to “meet standards at least as protective as Tier 4 standards for non-road diesel engines set out by the United States Environmental Protection Agency in 40 CFR 1039” and “operate solely as an emergency or standby unit in accordance with 35 Ill. Adm. Code 211.1920”; up to 24 sequential hours of operation after falling out of Tier 4 compliance during a power outage “shall not be considered a violation of the permit”; natural gas backup generators must meet Tier 2 standards for non-road large spark-ignition engines (40 CFR 1048). https://www.ilga.gov/documents/legislation/PublicActs/104/104-0458.htm (archived: https://web.archive.org/web/20261025155635/https://www.ilga.gov/documents/legislation/PublicActs/104/104-0458.htm) and bill status https://www.ilga.gov/Legislation/BillStatus?DocNum=25&GAID=18&DocTypeID=SB&SessionID=114 (archived: https://web.archive.org/web/20261025162320/https://www.ilga.gov/Legislation/BillStatus?DocNum=25&GAID=18&DocTypeID=SB&SessionID=114). Interpretation that Tier 4 equivalence can be met with add-on controls on Tier 2 or Tier 3 engines and that existing generators are unaffected: ALL4 Inc. (environmental permitting consultancy), “Illinois Data Centers: Fears for Tiers,” June 11, 2026. https://www.all4inc.com/4-the-record-articles/illinois-data-centers-fears-for-tiers/ (archived: https://web.archive.org/web/20261025152142/https://www.all4inc.com/4-the-record-articles/illinois-data-centers-fears-for-tiers/)
[5d] U.S. Department of Energy, Emergency Order No. 202-26-23 (Federal Power Act section 202(c)), issued May 18, 2026, effective May 18 through May 20, 2026: PJM “is authorized to direct backup generation resources at data centers” and other large load sites “as a last resort before declaring an Energy Emergency Alert (EEA) 3” or during an EEA 3; excluded facilities (defense, homeland security, first responder, air traffic control, hospitals, 911); PJM sets the times and parameters; resources “must otherwise comply with ancillary environmental requirements, including, but not limited to, monitoring, reporting, and recordkeeping requirements, to the maximum extent feasible”; PJM to notify DOE within one day of directing resources. DOE order page summary: “PJM is authorized to call upon its Transmission Owners and Electric Distribution Companies to implement this order as needed.” https://www.energy.gov/documents/doe-emergency-order-no-202-26-23pdf (archived: https://web.archive.org/web/20261025160019/https://www.energy.gov/documents/doe-emergency-order-no-202-26-23pdf). Order page: https://www.energy.gov/ceser/federal-power-act-section-202c-pjm-interconnection-llc-pjm-order-no-202-26-23 (archived: https://web.archive.org/web/20260706213120/https://www.energy.gov/ceser/federal-power-act-section-202c-pjm-interconnection-llc-pjm-order-no-202-26-23)
[5e] U.S. Department of Energy, “Federal Power Act Section 202(c): PJM Interconnection (PJM) Order No. 202-26-06,” order issued January 26, 2026, expiring January 31, 2026, authorizing PJM “to direct backup generation resources at data centers” as a last resort before or during an EEA 3; Order No. 202-26-06A issued January 29, 2026, extending the authorization through February 2, 2026; rehearing order 202-26-06B, February 4, 2026. https://www.energy.gov/ceser/federal-power-act-section-202c-pjm-interconnection-pjm-order-no-202-26-06 (archived: https://web.archive.org/web/20260810062617/https://www.energy.gov/ceser/federal-power-act-section-202c-pjm-interconnection-pjm-order-no-202-26-06). Order PDFs: https://www.energy.gov/documents/doe-order-no-202-26-06-pjm (archived: https://web.archive.org/web/20260706212823/https://www.energy.gov/documents/doe-order-no-202-26-06-pjm) and https://www.energy.gov/documents/order-no-202-26-06-pjm-backup-generators (archived: https://web.archive.org/web/20260706212824/https://www.energy.gov/documents/order-no-202-26-06-pjm-backup-generators)
[5f] PJM Interconnection, applications to the Secretary of Energy for section 202(c) orders. January 26, 2026 application: load forecast of about 138,000 MW for the Monday evening peak and 147,000 MW for the Tuesday morning peak; request that the order allow backup generation use “notwithstanding any applicable environmental limitations under federal or state law.” https://www.energy.gov/documents/pjm-application-202c-backup-generators (archived: https://web.archive.org/web/20261024150830/https://www.energy.gov/documents/pjm-application-202c-backup-generators). May 17, 2026 application: request that the order allow use “notwithstanding any applicable environmental limitations under federal, state, or local law or regulation” and “expressly allow” utilities “to disconnect the data centers from utility source power to automatically transfer them to back up generation.” https://www.energy.gov/documents/pjms-202c-backup-gen-application-202-26-23 (archived: https://web.archive.org/web/20260706213119/https://www.energy.gov/documents/pjms-202c-backup-gen-application-202-26-23). October 11, 2026 application: demand forecast “at or around 111,500 MW (or higher) on October 13” against generation outages “anticipated to reach around 61,591 MW”; same environmental-limitations request. https://www.pjm.com/-/media/DotCom/documents/other-fed-state/20261011-request-for-general-unit-operation-and-emergency-backup-section-202c.pdf (archived: https://web.archive.org/web/20261016132413/https://www.pjm.com/-/media/DotCom/documents/other-fed-state/20261011-request-for-general-unit-operation-and-emergency-backup-section-202c.pdf)
[5h] U.S. Department of Energy, “Federal Power Act Section 202(c): PJM Interconnection, L.L.C. (PJM) Order No. 202-26-50,” issued October 12, 2026 on PJM’s October 11 application, effective October 13 through October 16, 2026; directs dispatch of specified units and authorizes PJM to direct backup generation resources as a last resort before or during an EEA 3; paragraph E limits operation “to the times and within the parameters determined by PJM for maintaining grid reliability” and “consistent, to the maximum extent practicable, with any applicable environmental law,” and requires PJM to notify DOE daily of each Specified Resource and backup generation resource operated in reliance on the order. https://www.energy.gov/ceser/federal-power-act-section-202c-pjm-interconnection-llc-pjm-order-no-202-26-50 (archived: https://web.archive.org/web/20261025162313/https://www.energy.gov/ceser/federal-power-act-section-202c-pjm-interconnection-llc-pjm-order-no-202-26-50). Order PDF: https://www.energy.gov/documents/doe-order-no-202-26-50 (archived: https://web.archive.org/web/20261017134245/https://www.energy.gov/documents/doe-order-no-202-26-50). Intervening orders reported by Utility Dive (May 19, 2026, Ethan Howland, “PJM gets emergency approval to curtail data centers, large loads during hot weather,” https://www.utilitydive.com/news/pjm-doe-emergency-order-curtail-data-centers/820571/ (archived: https://web.archive.org/web/20260928161135/https://www.utilitydive.com/news/pjm-doe-emergency-order-curtail-data-centers/820571/)) and Gibson Dunn client alert, “DOE’s Emergency Order Signals New Role for Data Centers’ Backup Power,” May 21, 2026, https://www.gibsondunn.com/doe-emergency-order-signals-new-role-for-data-centers-backup-power/ (archived: https://web.archive.org/web/20260618203251/https://www.gibsondunn.com/doe-emergency-order-signals-new-role-for-data-centers-backup-power/)
[5i] PJM Interconnection, Inside Lines, David Souder, “Providing Reliable Electricity in a New Reality,” October 15, 2026: “The U.S. Department of Energy, for the ninth time this year, issued an order to allow PJM to direct backup generation at data centers and other Large Load electricity customers to operate to avoid outages to other customers”; “While PJM did not use that authority and has not done so to date, it remains a valuable tool to help protect regular customers.” https://insidelines.pjm.com/providing-reliable-electricity-in-a-new-reality/ (archived: https://web.archive.org/web/20261016154415/https://insidelines.pjm.com/providing-reliable-electricity-in-a-new-reality/). PJM, Inside Lines operations update, October 13, updated October 14, 2026: “PJM has not had to make use of Large Load backup generation to date.” https://insidelines.pjm.com/operations-update-extends-maximum-generation-alert-calls-on-demand-response/ (archived: https://web.archive.org/web/20261017134243/https://insidelines.pjm.com/operations-update-extends-maximum-generation-alert-calls-on-demand-response/). PJM daily compliance report under Order No. 202-26-50 for October 14 operations, dated October 15, 2026, listing six generating units and no backup generation: https://www.pjm.com/-/media/DotCom/documents/other-fed-state/20261015-pjm-daily-compliance-report-doe-order-no-202-26-50.pdf (archived: https://web.archive.org/web/20261025162436/https://www.pjm.com/-/media/DotCom/documents/other-fed-state/20261015-pjm-daily-compliance-report-doe-order-no-202-26-50.pdf). PJM Operating Committee, October 8, 2026, “202(c) Update in Preparation for Winter Season,” listing the prior backup generation orders (202-26-06/06A January 26; 202-26-23 May 18; 202-26-33/33A June 30 to July 7; 202-26-35 July 14 to 21; 202-26-40 August 21 to September 18; 202-26-41 September 1 to 8): https://www.pjm.com/-/media/DotCom/committees-groups/committees/oc/2026/20261008/20261008-item-13—202c-update-in-preparation-for-winter-season-presentation.pdf (archived: https://web.archive.org/web/20261012000035/https://www.pjm.com/-/media/DotCom/committees-groups/committees/oc/2026/20261008/20261008-item-13—202c-update-in-preparation-for-winter-season-presentation.pdf). Axios Richmond, Anna Spiegel and Karri Peifer, October 14, 2026: “Dominion confirmed Wednesday that none of the data centers it serves have been switched to backup generators because of the order or elevated grid conditions.” https://www.axios.com/local/richmond/2026/10/14/richmond-dominion-pjm-energy-emergency-order-blackouts (archived: https://web.archive.org/web/20261016211416/https://www.axios.com/local/richmond/2026/10/14/richmond-dominion-pjm-energy-emergency-order-blackouts)
[5j] Illinois EPA, Bureau of Air permit records, read October 24, 2026. CyrusOne LLC, 2905 E. Diehl Road, Aurora: Preliminary Draft CAAPP (Title V) Permit No. 17060002, dated March 17, 2026, “Purpose of Application: Issue New Permit to a New Major Source”; Condition 4.1.1 lists 91 diesel-fired emergency generators (6 x 2,500 kW; 8 x 2,750 kW; 8 x 2,500 kW; 4 x 2,250 kW; 28 x 2,250 kW; 36 x 2,250 kW; 1 x 1,250 kW); Condition 8.1(a) NOx 97.96 tons/year. https://webapps.illinois.gov/EPA/WebSiteApi/api/PublicNotices/GetAirPermitDocument/10253 (archived: https://web.archive.org/web/20261025160122/https://webapps.illinois.gov/EPA/WebSiteApi/api/PublicNotices/GetAirPermitDocument/10253). Hoffman Estates (CHI06 and CHI07) Data Center, 2045 Lakewood Boulevard, Hoffman Estates: construction permit, Application No. 23110003, issued December 19, 2024; 32 x 4,376 BHP (3,100 ekW) and 2 x 762 BHP (500 ekW) diesel generators; large units’ runtime “shall not exceed 1984 hours/year (combined),” NOx 38.85 tons/year. https://epa.illinois.gov/content/dam/soi/en/web/epa/topics/environmental-justice/documents/ira/ira-analyses/23110003.pdf (archived: https://web.archive.org/web/20261025160037/https://epa.illinois.gov/content/dam/soi/en/web/epa/topics/environmental-justice/documents/ira/ira-analyses/23110003.pdf). Prime Data Centers, 1600 East Higgins Road, Elk Grove Village: construction permit, Application No. 24090003, issued July 15, 2025; “Thirty-nine (39) 3,250 kW (4,656 BHP) Diesel-Powered Emergency Generators with 20 Generators equipped with Diesel Particulate Filters”; Tier 2; “The runtime of each Diesel-Powered Emergency Generator shall not exceed 35 hours/year (1,365 hr/yr combined).” https://epa.illinois.gov/content/dam/soi/en/web/epa/topics/environmental-justice/documents/ira/24090003.pdf (archived: https://web.archive.org/web/20261025160113/https://epa.illinois.gov/content/dam/soi/en/web/epa/topics/environmental-justice/documents/ira/24090003.pdf). Illinois EPA Modeling Unit (Mohammad Sweid), modeling memorandum for Prime Data Centers, permit 24090003, June 4, 2025: the applicant’s consultant (Atmospheric) “developed a cumulative modeling analysis that incorporated background concentrations based on nearby monitoring data as well as nearby emission inventory sources”; modeled exceedances of the 1-hour NO2 NAAQS (total 363.90 µg/m³ against 188.68 µg/m³); Prime’s maximum impact at an exceedance 0.16 µg/m³ against a 7.52 µg/m³ significant impact level; “Prime would not cause or contribute to an exceedance the 1-hour NO2 NAAQS.” https://epa.illinois.gov/content/dam/soi/en/web/epa/topics/environmental-justice/documents/ira/prime-data-centers-modeling-memo.pdf (archived: https://web.archive.org/web/20261025160028/https://epa.illinois.gov/content/dam/soi/en/web/epa/topics/environmental-justice/documents/ira/prime-data-centers-modeling-memo.pdf). Illinois EPA environmental justice notification letter, January 22, 2026, Stream ORD, 2000 Landmeier Road, Elk Grove Village, Construction Permit Application 25120023: “construct a new data center which will consist of 126 2.5 MW diesel emergency generators.” https://epa.illinois.gov/content/dam/soi/en/web/epa/topics/environmental-justice/documents/notification-letters/2026/Stream%20ORD%20031440AWO%20Construction%2025120023.pdf (archived: https://web.archive.org/web/20261025155002/https://epa.illinois.gov/content/dam/soi/en/web/epa/topics/environmental-justice/documents/notification-letters/2026/Stream%20ORD%20031440AWO%20Construction%2025120023.pdf). Illinois EPA, Informal Resolution Agreement Analyses page (agreement “voluntarily entered into by Illinois EPA with USEPA on February 14, 2024”; permit, EJ/Title VI review, and modeling memorandum posted for “construction projects that meet the applicability requirements of the Informal Resolution Agreement”): https://epa.illinois.gov/topics/environmental-justice/informal-resolution-agreement-analyses.html (archived: https://web.archive.org/web/20261025132324/https://epa.illinois.gov/topics/environmental-justice/informal-resolution-agreement-analyses.html)
[6a] Southern Environmental Law Center, “Groups appeal permit for xAI’s South Memphis data center, decisions around unpermitted methane gas turbines,” July 16, 2025: permit issued July 2 for 15 turbines; SCHD “claimed that the federal Clean Air Act didn’t apply to xAI’s unpermitted gas turbines, citing an exemption for ‘nonroad engines’”; SELC: xAI was “unlawfully installing 35 polluting methane gas turbines at the site before getting a permit.” Timeline in SELC, “Inside Memphis’ fight against xAI”: 60-day notice of intent on behalf of the NAACP, after which “xAI removes all unpermitted turbines from the site,” then permit approval for 15. https://www.selc.org/news/inside-memphis-fight-against-xai/ (archived: https://web.archive.org/web/20261011221131/https://www.selc.org/news/inside-memphis-fight-against-xai/) and https://www.selc.org/press-release/groups-appeal-permit-for-xais-south-memphis-data-center-decisions-around-unpermitted-methane-gas-turbines/ (archived: https://web.archive.org/web/20260921144853/https://www.selc.org/press-release/groups-appeal-permit-for-xais-south-memphis-data-center-decisions-around-unpermitted-methane-gas-turbines/) [Advocacy source; SELC represents plaintiffs.]
[6b] Earthjustice, “NAACP Sues xAI for Illegal Pollution from Data Center Power Plant,” April 14, 2026. “xAI is illegally operating 27 gas turbines without an air permit in Southaven, Mississippi”; 60-day notice of intent “sent to xAI in February”; potential to emit “more than 1,700 tons of smog-forming nitrogen oxides (NOx) each year.” https://earthjustice.org/press/2026/xai-sued-for-illegal-power-plant (archived: https://web.archive.org/web/20260824150018/https://earthjustice.org/press/2026/xai-sued-for-illegal-power-plant) [Advocacy source; Earthjustice and SELC represent plaintiffs.]
[6c] Neil Strebig, Memphis Commercial Appeal, “NAACP alleges 57 turbines active at xAI Southaven site in lawsuit,” June 11, 2026 (republished by AOL as “57 turbines at xAI Southaven site, lawsuit cites emissions concerns”). MDEQ exemption of 18 temporary turbines, August 2025; count of 27 by December 2025; MDEQ PSD permit for 41 turbines approved March 10, 2026; MDEQ confirmation on May 13, 2026 that 46 turbines were operating without a permit; 57 on site per discovery emails of May 15, 2026; motion to amend filed June 10, 2026. https://www.aol.com/articles/57-turbines-xai-southaven-lawsuit-213632000.html (archived: https://web.archive.org/web/20261025155313/https://www.aol.com/articles/57-turbines-xai-southaven-lawsuit-213632000.html)
[6d] U.S. EPA, “Air Plan Approval and Air Quality Designation; TN; Redesignation of the Shelby County 2008 8-Hour Ozone Nonattainment Area to Attainment,” 81 Fed. Reg. 40816 (June 23, 2016), FR Doc. 2016-14807, effective July 25, 2016; maintenance plan for the Tennessee portion of the Memphis, TN-MS-AR area “through 2027.” https://govinfo.gov/link/fr/81/40816 (archived: https://web.archive.org/web/20261025162258/https://govinfo.gov/link/fr/81/40816)
[7] Lawrence Berkeley National Laboratory, “2024 United States Data Center Energy Usage Report” (LBNL-2001637), December 2024. https://eta-publications.lbl.gov/sites/default/files/2024-12/lbnl-2024-united-states-data-center-energy-usage-report.pdf (archived: https://web.archive.org/web/20261025160205/https://eta-publications.lbl.gov/sites/default/files/2024-12/lbnl-2024-united-states-data-center-energy-usage-report.pdf)
[8] U.S. Geological Survey, Medalie, L. et al., “Water use across the conterminous United States, water years 2010-20,” Chapter D, National Integrated Water Availability Assessment, Professional Paper 1894, January 2025. Crop irrigation withdrawals averaged 105,497 million gallons per day (CONUS) for water years 2010-2020. Supersedes the 2015 Circular 1441 estimate (118 Bgal/d) as the current national modeled estimate. https://pubs.usgs.gov/publication/pp1894D (archived: https://web.archive.org/web/20261024150117/https://pubs.usgs.gov/publication/pp1894D)
[9] Google (Alphabet), 2025 Environmental Report, covering calendar 2024, “Alphabet’s Schedule of Water Use by Data Center Location For the Year Ended December 31 2024 (million gallons),” p. 114, and the environmental data table, p. 110: Council Bluffs, IA, withdrawal 1,410.3, discharge 400.1, consumption 1,010.2; next highest Mayes County, OK, withdrawal 1,108.3. Daily figures are this article’s division by 365. Self-reported. https://www.gstatic.com/gumdrop/sustainability/google-2025-environmental-report.pdf (archived: https://web.archive.org/web/20261025155921/https://www.gstatic.com/gumdrop/sustainability/google-2025-environmental-report.pdf). Also summarized by MOST Policy Initiative, “Data Center Water Use,” Science Note, April 8, 2026: https://mostpolicyinitiative.org/science-note/data-center-water-use/ (archived: https://web.archive.org/web/20260908212218/https://mostpolicyinitiative.org/science-note/data-center-water-use/)
[9a] University of Illinois Extension, “The groundwater guide: Where our water comes from and the challenges communities face,” Everyday Environment series, May 2025. DeKalb, McHenry, Boone, and Winnebago counties identified as 100% dependent on groundwater aquifers for drinking water. https://extension.illinois.edu/blogs/everyday-environment/2025-05-08-groundwater-guide-where-our-water-comes-and-challenges (archived: https://web.archive.org/web/20260514140536/https://extension.illinois.edu/blogs/everyday-environment/2025-05-08-groundwater-guide-where-our-water-comes-and-challenges)
[9b] City of Yorkville, “New Water Source,” official city website. Illinois Office of Water Resources finding that the region’s deep aquifer is being withdrawn roughly twice as fast as it recharges; City Council vote (2021) to switch to Lake Michigan water via the DuPage Water Commission; an earlier city estimate of $90 million or more for Yorkville’s cost, since superseded (see [9d]); funded in part through phased water rate increases beginning September 2022. https://www.yorkville.il.us/811/New-Water-Source (archived: https://web.archive.org/web/20261024150620/https://www.yorkville.il.us/811/New-Water-Source)
[9c] Pipeline & Gas Journal, “$400-MM WaterLink pipeline advances across Illinois,” September 4, 2026: “a nearly $400-MM regional water pipeline,” 30 miles, serving Montgomery, Oswego and Yorkville; “Construction began in December 2025”; “scheduled for completion in 2028.” https://pgjonline.com/news/2026/september/400-mm-waterlink-pipeline-advances-across-illinois (archived: https://web.archive.org/web/20261025162310/https://pgjonline.com/news/2026/september/400-mm-waterlink-pipeline-advances-across-illinois). Village of Oswego, “New Water Source”: cost shares Oswego 35.36%, Montgomery 24.42%, Yorkville 40.22%; switchover targeted for 2028, moved from 2027; Illinois Office of Water Resources: “water is being withdrawn twice as fast as it is being replenished.” https://www.oswegoil.org/government/departments/public-works/water/new-water-source (archived: https://web.archive.org/web/20260114044626/https://www.oswegoil.org/government/departments/public-works/water/new-water-source)
[9d] Shaw Local (Kendall County Now), “Yorkville’s $170 million federal EPA loan for Lake Michigan water project stuck in limbo,” June 17, 2026: $224.4 million Yorkville project cost; $170 million WIFIA loan signed by EPA but not closed; regional project about $400 million for a 30-mile transmission main; Lake Michigan water expected in Yorkville by summer 2028; 20% annual rate increases over five years. https://shawlocal.com/kendall-county-now/2026/06/17/yorkvilles-170-million-federal-epa-loan-for-lake-michigan-water-project-stuck-in-limbo/ (archived: https://web.archive.org/web/20260831050426/https://shawlocal.com/kendall-county-now/2026/06/17/yorkvilles-170-million-federal-epa-loan-for-lake-michigan-water-project-stuck-in-limbo/)
[9e] Illinois Water Use Act of 1983, 525 ILCS 45, as amended by Public Act 96-0222 (effective January 1, 2010). Sec. 4: “high capacity” withdrawals are those “equal to or in excess of 100,000 gallons during any 24-hour period”; “reasonable use” means “the use of water to meet natural wants and a fair share for artificial wants.” Sec. 5: notice to the local Soil and Water Conservation District “before construction of the well begins” for a new point of withdrawal reasonably expected to exceed 100,000 gallons on any day; district review of the effect on other users with the Illinois State Water Survey and State Geological Survey, completed within 30 days and made public. Sec. 5.1: district may “recommend to the Department of Agriculture that the Department restrict the quantity of water” from high-capacity wells after an on-site investigation finds a substantial groundwater decline. Sec. 5.1(a): a land occupier with a high-capacity well “shall register that point of withdrawal with the District.” Sec. 5.3: owners of high-capacity wells, intakes, and public water supplies “shall participate in the Illinois State Water Survey’s Illinois Water Inventory Program.” The Act contains no withdrawal permit. https://ilga.gov/ftp/Public%20Acts/96/096-0222.htm (archived: https://web.archive.org/web/20250330170455/https://ilga.gov/ftp/Public%20Acts/96/096-0222.htm)
[9f] 77 Ill. Adm. Code 920.130, Water Well Permit Requirements (Illinois Water Well Construction Code): “A permit to construct a new water well, modify an existing water well or seal an abandoned water well shall be obtained from the Department or approved local health department prior to start of work.” https://www.ilga.gov/ftp/JCAR/AdminCode/077/077009200001300R.html (archived: https://web.archive.org/web/20250330081405/https://www.ilga.gov/ftp/JCAR/AdminCode/077/077009200001300R.html)
[9g] City of Rockford, Illinois, “Draft of Text Amendments for Data Centers,” Article 40-002-P, clean draft dated October 15, 2026 (Legistar matter 26-01252, laid over by the Code and Regulation Committee October 19, 2026; not adopted). Section 8(c), p. 5: “All water and sewer services for the Data Center will be provided by the public water system, except for water transported on site. No water well or sanitary sewer system will be constructed or used for the Data Center operations.” https://rockfordil.legistar1.com/rockfordil/attachments/13197a6d-c674-449d-8570-02e77a33b872.pdf (archived: https://web.archive.org/web/20261025032536/https://rockfordil.legistar1.com/rockfordil/attachments/13197a6d-c674-449d-8570-02e77a33b872.pdf) [10] Jon Gorey, Lincoln Institute of Land Policy, Land Lines, “Data Drain: The Land and Water Impacts of the AI Boom,” October 17, 2025. Newton County: Meta facility at 500,000 gallons per day and 10% of county consumption (citing The New York Times, July 14, 2025); pending permit requests that “would use up to 6 million gallons of water per day, more than doubling what the entire county currently consumes.” https://www.lincolninst.edu/publications/land-lines-magazine/articles/land-water-impacts-data-centers/ (archived: https://web.archive.org/web/20261016043851/https://www.lincolninst.edu/publications/land-lines-magazine/articles/land-water-impacts-data-centers/)
[10a] Richard Elliot, WSB-TV Channel 2 Atlanta, “North Georgia neighbors say data center responsible for dirty well water,” May 27, 2026. Station reporting: Meta takes about 102,000 gallons of Newton County water a day, used in a closed system, about 2% of county water usage. Meta statement: commissioned groundwater study found no impact on residents. https://www.wsbtv.com/news/local/north-georgia-neighbors-say-data-center-responsible-dirty-well-water/YERXGUYXHVAGPIAPQJ6ILVC4BQ/ (archived: https://web.archive.org/web/20260715103535/https://www.wsbtv.com/news/local/north-georgia-neighbors-say-data-center-responsible-dirty-well-water/YERXGUYXHVAGPIAPQJ6ILVC4BQ/)
[10b] City of DeKalb, Ordinance 2020-023, annexation and development agreement with Ventus Tech Services LLC (Project Ventus, Meta DeKalb Data Center), passed April 27, 2020, recorded with the DeKalb County Recorder as 2020003729; Exhibit G, Water Agreement. Sec. 5: “No consumption measures or limitations arising from such shortages shall apply to the Project, unless required by clear and critical public health conditions and applicable Law.” Confidentiality: “data and information related to Customer’s actual or projected consumption or usage of all or any portion of the Reservations shall be deemed Confidential Business Information,” not to be disclosed to any third party “without the prior written consent, and at the sole discretion of, Customer.” https://www.cityofdekalb.com/DocumentCenter/View/11090/Ord-2020-023-Passed-042720-Ventus-Annex-Dev-Agr (archived: https://web.archive.org/web/20261025151515/https://www.cityofdekalb.com/DocumentCenter/View/11090/Ord-2020-023-Passed-042720-Ventus-Annex-Dev-Agr). Resolution 2020-120, passed October 26, 2020, First Amendment to the Water Agreement with Goldframe LLC to correct a scrivener’s error: Exhibit B: “The Water capacity reservation for each Tier of the Project is 400,000 gallons per day”; peak daily volume 400,000, 800,000, and 1,200,000 gallons for Tiers I to III. https://www.cityofdekalb.com/DocumentCenter/View/12153/Res-2020-120-Passed-102620-Water-Agr-Facebook (archived: https://web.archive.org/web/20261025125713/https://www.cityofdekalb.com/DocumentCenter/View/12153/Res-2020-120-Passed-102620-Water-Agr-Facebook)
[10c] Meta, 2025 Environmental Data Index (fiscal 2024), “Water Withdrawal by Facility (in megaliters)”: DeKalb (IL) 0, 30, 55, and 105 for 2021 to 2024 (company source). https://sustainability.atmeta.com/wp-content/uploads/2025/10/Meta_2025-Environmental-Data-Index.pdf (archived: https://web.archive.org/web/20261025160322/https://sustainability.atmeta.com/wp-content/uploads/2025/10/Meta_2025-Environmental-Data-Index.pdf). Bear Savage and Jenna Dooley, WNIJ, November 24, 2025, reporting DeKalb City Manager Bill Nicklas that Meta uses “up to 200,000 gallons of water a day for their cooling process.” https://www.northernpublicradio.org/wnij-news/2025-11-24/public-can-weigh-in-on-proposal-for-500-acre-data-center-in-dekalb (archived: https://web.archive.org/web/20260306120814/https://www.northernpublicradio.org/wnij-news/2025-11-24/public-can-weigh-in-on-proposal-for-500-acre-data-center-in-dekalb)
[10d] Ben Howell, WGLT/NPR Illinois, “How Aurora and DeKalb residents are dealing with data centers,” August 3, 2026: City Manager Bill Nicklas said “the city has not had to deal with complaints about the center due to noise … or any other pollution issue”; the campus sits “roughly a mile from the nearest homes.” https://www.nprillinois.org/illinois/2026-08-03/how-aurora-and-dekalb-residents-are-dealing-with-data-centers (archived: https://web.archive.org/web/20261025160423/https://www.nprillinois.org/illinois/2026-08-03/how-aurora-and-dekalb-residents-are-dealing-with-data-centers)
[11a] Shaw Local (Kendall County Now), “Yorkville says Project Cardinal data center water consumption projected now at 350,000 gallons daily,” October 17, 2025. https://www.shawlocal.com/kendall-county-now/2025/10/17/yorkville-says-project-cardinal-data-center-water-consumption-projected-now-at-350000-gallons-daily/ (archived: https://web.archive.org/web/20260923145043/https://www.shawlocal.com/kendall-county-now/2025/10/17/yorkville-says-project-cardinal-data-center-water-consumption-projected-now-at-350000-gallons-daily/)
[11m] Joey Weslo, Shaw Local News Network (Kendall County Now), “Yorkville OKs ‘larger than Central Park in New York’ data center campus,” November 14, 2025. Unanimous approval of the Project Cardinal PUD on November 10, 2025: 4,900 new trees; a landscaped 12-foot berm near residential properties narrowing to eight feet elsewhere; 625-foot setback from Bristol Bay and 1,200 feet from Equestrian Estates; 78-foot height limit including rooftop equipment; generator testing only during daytime; city monitoring of light pollution; phased construction under a 20-year PUD. https://www.shawlocal.com/kendall-county-now/2025/11/11/yorkville-oks-1037-acre-project-cardinal-data-center/ (archived: https://web.archive.org/web/20260415165443/https://www.shawlocal.com/kendall-county-now/2025/11/11/yorkville-oks-1037-acre-project-cardinal-data-center/)
[11n] Burns & McDonnell (Gary Koons, Development Manager, for the Engineer of Record), Project Cardinal Water Usage Memo to the United City of Yorkville, September 5, 2025: “The draft values provided below are domestic water usages”; “We are looking to determine potential makeup water for a closed loop system but at this time is undetermined”; 1.8 peaking factor for maximum day; figures “planning level and subject to change.” Posted on the city’s Project Cardinal page. https://www.yorkville.il.us/DocumentCenter/View/11747 (archived: https://archive.org/details/project-cardinal-memo-water-2025-09-05, an unaltered copy uploaded October 25, 2026, because the Wayback Machine could not capture the city’s file)
[11c] WSPY News, “Yorkville approves engineering deal for data center water extensions,” October 2025. City Administrator Bart Olson; city officials’ statement that Project Cardinal’s original 350,000 gpd design is roughly half the per-acre water intensity of a residential subdivision. https://www.wspynews.com/news/local/yorkville-approves-engineering-deal-for-data-center-water-extensions/article_09a6145f-e0c3-4eda-ba4d-31f15f3d58a7.html (archived: https://web.archive.org/web/20260908191705/https://www.wspynews.com/news/local/yorkville-approves-engineering-deal-for-data-center-water-extensions/article_09a6145f-e0c3-4eda-ba4d-31f15f3d58a7.html)
[11o] United City of Yorkville, City Council Packet, June 23, 2026, agenda item EDC 2026-31 (Project Cardinal, Pioneer Development LLC). Community Development Director’s memo dated June 3, 2026, packet pp. 369 to 371: Utility and Infrastructure Agreement and Development Agreement approved March 10, 2026 by Ordinance No. 2026-23 (executed copy, Section 4.1: the City “will provide water” at 42,000 gpd average day and 71,400 gpd maximum day, overuse billed at twice the volumetric rate; Section 3.6: HVO or biodiesel for generator testing; no well provision; https://www.yorkville.il.us/DocumentCenter/View/13590/Ordinance-2026-23—need-signed-agreements?bidId= (archived: https://web.archive.org/web/20261025151443/https://www.yorkville.il.us/DocumentCenter/View/13590/Ordinance-2026-23—need-signed-agreements?bidId=)); closing-notice deadline extension from July 1, 2026 to December 31, 2027. Draft Memorandum of Understanding (Pioneer Development redline dated May 21, 2026), packet pp. 378 to 381, Section 4.1 Water Allocation: “The City acknowledges that the provisions of adequate amounts of potable water is essential for the development of the Project”; “(Average Day) 42,000 gallons per day (Maximum Day) 71,400 gallons per day”; penalty “equal to two times the then-existing volumetric water rate on the difference between the actual average day and the estimated average day of 42,000 gallons for the entire billing cycle”; for any day over 71,400 gallons, the same double rate “until compliance with the water allocation standards are met or further improvements to the water service system are completed at the sole cost of the Developer.” Same packet, City Administrator memo dated June 18, 2026, p. 233, and Conditional Settlement Agreement and Releases, Bryan v. Yorkville, Kendall County Case No. 2025 CH 000028, from p. 239. https://www.yorkville.il.us/ArchiveCenter/ViewFile/Item/6803 (archived: https://web.archive.org/web/20261025162608/https://www.yorkville.il.us/ArchiveCenter/ViewFile/Item/6803). Adoption: Minutes of the Regular Meeting of the City Council, June 23, 2026 (as reproduced in the July 14, 2026 council packet): Ordinance 2026-43 approving the conditional settlement, roll call 5-1 (Corneils nay); Ordinance 2026-44 approving the first amendment to the annexation agreement, 6-1; Ordinance 2026-45 approving the memorandum of understanding, 5-1 (Corneils nay). https://www.yorkville.il.us/ArchiveCenter/ViewFile/Item/6824 (archived: https://web.archive.org/web/20261025162615/https://www.yorkville.il.us/ArchiveCenter/ViewFile/Item/6824)
[11p] WSPY News, “Air-cooled design reduces wastewater concerns for Yorkville projects,” March 10, 2026, reporting the Yorkville-Bristol Sanitary District’s February 2026 board meeting. Executive Director Cyrus McMains: “The cooling process systems approaches have been revised and now will not use water”; “This means that the data centers will only discharge sanitary waste to YBSD”; “The sanitary wastewater will be domestic strength or similar from other office buildings and homes”; “YBSD has still not received any plans from the prospective data centers.” https://www.wspynews.com/news/local/air-cooled-design-reduces-wastewater-concerns-for-yorkville-projects/article_ba7331c8-6c74-4ae4-9658-f851ba5c6951.html (archived: https://web.archive.org/web/20261025162525/https://www.wspynews.com/news/local/air-cooled-design-reduces-wastewater-concerns-for-yorkville-projects/article_ba7331c8-6c74-4ae4-9658-f851ba5c6951.html)
[11q] United City of Yorkville, City Council Packet, July 14, 2026, item PZC 2026-03 & EDC 2026-30, First Amendment to the Planned Unit Development Agreement with C1 Yorkville, LLC (CyrusOne CHI-11, approximately 228 acres): water allocation reduced from 500,000 to 40,000 gallons per day with closed-loop cooling; Section on mechanical screening and noise: noise study by Trinity Consultants “reviewed and accepted by the City’s 3rd party review engineer (Soundscape Engineering)”; “The Developer agrees to be responsible for the continuous noise monitoring”; project “subject to the requirements of the City’s Noise Ordinance, Title 4, Chapter 4”; “the City’s ordinance exempts the emergency operation of generators from regulation”; final noise study with each building permit “consistent with the standards set forth on Exhibit H,” presented to the City Council. Exhibit G, Trinity Consultants, CyrusOne Yorkville AHJ Noise Study, May 21, 2026: long-term background measurements September 3 to 4, 2024 (nighttime L90 38 to 41 dBA); projected nighttime data center levels of 30 to 45 dBA at receivers against a 60/50 dBA day/night code limit. Exhibit H, Soundscape Engineering, “Recommended Guidelines for Data Center Noise Impact Studies Submitted with Permit Applications, Rev. 1,” July 14, 2026: octave-band sound power data, measured data preferred; tonality assessment; reasonable worst-case conditions; routine generator testing; updated ambient survey optional but recommended. https://www.yorkville.il.us/ArchiveCenter/ViewFile/Item/6824 (archived: https://web.archive.org/web/20261025162615/https://www.yorkville.il.us/ArchiveCenter/ViewFile/Item/6824) and https://www.yorkville.il.us/ArchiveCenter/ViewFile/Item/6827 (archived: https://web.archive.org/web/20261025162621/https://www.yorkville.il.us/ArchiveCenter/ViewFile/Item/6827). Adoption: Minutes of the Regular Meeting of the City Council, July 14, 2026 (as reproduced in the July 28, 2026 council packet): Ordinance 2026-50, Exhibit H amendment 7-0, main motion 7-0; Alderman Marek on noise issues at CyrusOne’s Aurora campus; CyrusOne attorney Russ Whitaker that the Aurora campus “was approved around 2017, prior to the predictive modeling and noise standards they follow now.” https://www.yorkville.il.us/ArchiveCenter/ViewFile/Item/6839 (archived: https://web.archive.org/web/20261025162729/https://www.yorkville.il.us/ArchiveCenter/ViewFile/Item/6839)
[11r] Engineering Enterprises, Inc. (EEI), “Water Planning for Data Center Developments, Progress Meeting, March 6, 2026,” presentation in the United City of Yorkville City Council Packet, March 10, 2026, Supplemental Packet 2 (Project Cardinal), packet pp. 91 to 126. Projected water use table (developer estimates received August 29, 2025): CyrusOne CHI 11, 9,228 gpd average / 23,004 maximum day; Project Cardinal 42,000 / 71,400; Project Steel 23,198 / 39,437; five further projected developments; totals 98,425 gpd average day and 174,639 gpd maximum day. Projected average day demand, city plus data centers, 3.660 MGD in 2050 against an IDNR allocation of 3.566 MGD; “Additional capacity available in DWC pipeline = 3 MG”; recommendations specific to data center developments: “No significant improvements were identified” for 3 to 10 years, “Potentially new back-up well” beyond 10 years. Connection fee analysis dated February 17, 2026: Project Cardinal $3,578,400; Project Steel $1,976,504; components include DWC/Lake Michigan supply, extra transmission capacity, storage, and backup wells at $6,390 per population equivalent of 75 gpd. Same packet series, Supplemental Packet 1 (Project Steel), Community Development memo: Project Steel to use an air-cooled closed-loop system, “no City water will be used for cooling,” daily use “for potable uses by employees”; original estimate of 130,000 gpd communicated September 2025; Cardinal and Steel “have funded a water planning study prepared by the City’s engineering consultant, EEI.” https://www.yorkville.il.us/ArchiveCenter/ViewFile/Item/6669 (archived: https://web.archive.org/web/20261025154932/https://www.yorkville.il.us/ArchiveCenter/ViewFile/Item/6669) and https://www.yorkville.il.us/ArchiveCenter/ViewFile/Item/6668 (archived: https://web.archive.org/web/20260313220706/https://www.yorkville.il.us/ArchiveCenter/ViewFile/Item/6668)
[11d] Shiner Acoustics, LLC, “Project Steel Environmental Noise Assessment,” SA project 1250506, Revision C, September 19, 2025, prepared for Prologis, in the United City of Yorkville City Council Packet, March 24, 2026, PDF pp. 807 onward (Summary, p. 809): average baseline L90 sound levels of 39 to 42 dBA; Yorkville limits 60 dBA day and 50 dBA night; Illinois limits for unincorporated residences about 55 dBA day and 44 dBA night; base design predicted at “49 to 65 dBA at residential receivers” with standard-noise chillers and generators, “which exceeds both noise codes.” https://www.yorkville.il.us/ArchiveCenter/ViewFile/Item/6695 (archived: https://web.archive.org/web/20260409172641/https://www.yorkville.il.us/ArchiveCenter/ViewFile/Item/6695)
[11s] United City of Yorkville, Ordinance No. 2026-32, approving a Planned Unit Development Agreement with Prologis, L.P. (Project Steel), passed March 24, 2026, executed copy (scanned; read by text recognition of the page images, October 25, 2026): Section 2.1, entitlements “fully vested and protected from amendments and changes to City ordinances, codes, or regulations for a period of twenty (20) years from the Effective Date,” provided the project commences within three years; Section 2.2, “Section 10-4-10 of the UDO is reserved for additional regulations applicable to Energy Industrial Uses. The Developer has requested and the City hereby agrees that, for a period of fifteen (15) years from the Effective Date, any standards adopted to further regulate Energy Industrial Uses shall be waived and not applicable to the Subject Property”; Section 2.3, construction over a twenty-year period in three phases; Section 3.3 noise terms as below; Section 3.4, water usage “governed by the terms of the Utility Agreement”; Exhibit H, the Shiner Acoustics initial noise study. https://www.yorkville.il.us/DocumentCenter/View/13598 (archived: https://web.archive.org/web/20261025160732/https://www.yorkville.il.us/DocumentCenter/View/13598). Packet version: City Council Packet, March 24, 2026 (Project Steel approval). Planned Unit Development Agreement between the United City of Yorkville and Prologis, L.P. (Project Steel), Section 3.3, Noise Studies and Noise Monitoring: “At the onset of each phase of construction, Developer shall install continuous noise monitoring devices recommended by a sound engineer chosen by the City”; devices “maintained throughout the life of the Project,” with City access to data on request; on notice of an exceedance, Developer “shall investigate the source of the noise and identify and implement one or more means to mitigate”; final noise study based on “actual sound level measurements of that specific equipment … and not on interpolated, extrapolated, or otherwise calculated sound levels,” with a mitigation plan meeting local limits “which includes the penalty for tonal equipment.” City presentation in the same packet: daytime limit 60 dBA and nighttime 50 dBA, “10 dbA penalties to those limits for tonal noise (i.e. limit of 50 dbA daytime / 40 dbA nighttime).” Shiner Acoustics, Project Steel noise evaluation, September 19, 2025: baseline L90 39 to 42 dBA (measured June 23 to 27, 2025); Illinois limits for commercial to residential about 55 dBA day and 44 dBA night; base design predicted at 49 to 65 dBA at residential receivers, “which exceeds both noise codes”; with lower-noise chillers and sound walls “predicted to achieve compliance with the Yorkville limits”; for the Illinois limits, “substantial compliance” with “the lowest-noise chillers and low-noise generators.” https://www.yorkville.il.us/ArchiveCenter/ViewFile/Item/6695 (archived: https://web.archive.org/web/20260409172641/https://www.yorkville.il.us/ArchiveCenter/ViewFile/Item/6695)
[11t] City of Aurora, Illinois. Ordinance O26-022, Legistar 26-0112 Exhibit A-FINAL, Zoning Ordinance Section 49-104.3(c)(25), data center facility conditional use: “A baseline pre-development sound study with minimum and maximum dB (A) levels measured for a continuous weeklong period”; Noise Modeling Study by a third-party acoustical engineer; “Evaporative chillers utilizing potable water are prohibited”; roof-mounted chillers not within 1,500 feet, ground-mounted chillers and generators not within 1,000 feet of any residential, hospital or educational use; “Roof-mounted generators are prohibited”; generators to comply with Public Act 104-0458 “including but not limited to Tier 4 emission standards in 415 ILCS 5/39(a)”; noise “must not exceed the following constant-minimum noise thresholds as measured at the facility property line: Daytime hours 57 dB (A) weighted 7am-7pm; and Nightime hours 47 dB (A) weighted 7pm-7am”; continuous vibration monitoring; PUE no more than 1.2; “Water Usage Effectiveness of no more than two tenths (0.2),” potable building water (liters) per IT equipment kilowatt-hour. https://www.aurora.il.us/files/sharedassets/mainsite/v/1/environment/documents/o26-022.pdf (archived: https://web.archive.org/web/20261025155804/https://www.aurora.il.us/files/sharedassets/mainsite/v/1/environment/documents/o26-022.pdf). Ordinance O26-021, Legistar 26-0092, Chapter 50, Aurora Responsible Data Center Ordinance, applicable to all data centers in city limits: generator testing “regardless of whether installed before or after March 25, 2026, may only occur between the hours of 9:00 am and 5:00 pm Monday through Friday, and not on holidays. No more than two (2) generators may be tested simultaneously”; annual ENERGY STAR Portfolio Manager energy and water report and “Third party tested noise level reports … during both daytime hours and nighttime hours at the property line,” made publicly available by June. https://www.aurora.il.us/files/sharedassets/mainsite/v/1/environment/documents/o26-021.pdf (archived: https://web.archive.org/web/20261025155729/https://www.aurora.il.us/files/sharedassets/mainsite/v/1/environment/documents/o26-021.pdf). City pages: “New Data Center and Warehouse Regulations,” https://www.aurora.il.us/Property-Business/Zoning-and-Planning/New-Data-Center-and-Warehouse-Regulations (archived: https://web.archive.org/web/20261010000331/https://www.aurora.il.us/Property-Business/Zoning-and-Planning/New-Data-Center-and-Warehouse-Regulations); “City Council Approves Regulations on Data Centers,” March 25, 2026 (moratorium enacted September 25, 2025; ordinances approved March 24, 2026), https://www.aurora.il.us/News-articles/City-Council-Approves-Regulations-on-Data-Centers (archived: https://web.archive.org/web/20260511095055/https://www.aurora.il.us/News-articles/City-Council-Approves-Regulations-on-Data-Centers); “CyrusOne Noise Mitigation Updates,” April 23, 2026: “a permanent solution to the noise complaints that have affected the area,” https://www.aurora.il.us/News-articles/CyrusOne-Noise-Mitigation-Updates (archived: https://web.archive.org/web/20260424002055/https://www.aurora.il.us/News-articles/CyrusOne-Noise-Mitigation-Updates)
[11u] Ben Howell, WGLT / Illinois Newsroom, “In data center hubs Aurora and DeKalb, two different approaches to setting restrictions,” August 11, 2026. CyrusOne Aurora campus drew “consistent complaints from nearby residents,” mainly about rooftop cooling fans; DeKalb City Manager Bill Nicklas on metered water at Meta and on the newer facility “not using water for cooling.” https://ipmnewsroom.org/in-data-center-hubs-aurora-and-dekalb-two-different-approaches-to-setting-restrictions/ (archived: https://web.archive.org/web/20261024145913/https://ipmnewsroom.org/in-data-center-hubs-aurora-and-dekalb-two-different-approaches-to-setting-restrictions/)
[11v] Pioneer Development, LLC, “Project Cardinal, Air Quality Profile,” presentation at the United City of Yorkville City Council meeting of March 10, 2026, posted on the city’s Project Cardinal project page. “Over 89% of backup generators for data centers in Virginia … have Tier II controls,” sourced on the slide to “Virginia JLARC, Data Centers in Virginia (2024); Piedmont Environmental Council (2025); Virginia DEQ permit data”; commitments: “Tier IV controls,” “DPF,” “SCR,” “DOC,” “HVO renewable fuel,” “Testing and maintenance only,” “No other backup generator dispatch permitted per executed PUD Agreement with the City of Yorkville,” testing window of weekdays, 11 AM to 5 PM, non-holidays, “per Yorkville Ordinance 2025-53 and PUD Agreement”; “In 2024, the average ComEd customer experienced approximately 32 minutes of total outage for the entire year,” sourced to PA Consulting ReliabilityOne (2025), EEI Benchmark Study (2025), and the Illinois Commerce Commission Performance Metrics Report (2024); solid oxide fuel cell “Energy Server” option, “Up to 85% fewer backup generators if deployed,” “subject to procurement availability.” https://www.yorkville.il.us/DocumentCenter/View/12721/Project-Cardinal—Air-Quality-Deck_Presentation-3-10-26?bidId= (archived: https://web.archive.org/web/20261025151321/https://www.yorkville.il.us/DocumentCenter/View/12721/Project-Cardinal—Air-Quality-Deck_Presentation-3-10-26?bidId=) [Developer presentation; figures are the petitioner’s.]
[11w] United City of Yorkville, City Council Packet, June 10, 2025 (ArchiveCenter Item 6268). Written public comment correspondence, packet pp. 234 to 236: resident email of March 25, 2025 (“could cause significant noise pollution in this area to residents, causing neurological and mental health stressors in addition to medical issues and complications”) with links to Washington Department of Ecology, EPA DERA, American Cancer Society, and California Air Resources Board diesel pages, and City Administrator Bart Olson’s replies of March 27 and 31, 2025: that none of the data centers nearer the resident’s home will use well water, “neither their own or the City wells,” and “They are not anticipated to begin operation until well after we have converted to the Lake Michigan source”; “We have spoken with our government counterparts in Loudoun County Virginia, which is the data center capital of the world. They have spoken a bit about noise complaints being the most frequent issue cited by neighbors, but they tended to downplay the severity of it compared to your assertion of medical issues and complications.” Staff memorandum, Sara Mendez, Planner I, to the Planning and Zoning Commission, May 7, 2025, “PZC 2025-05 Data Center Development Standards, Text Amendment,” packet pp. 394 to 410, comparing Loudoun County, Prince William County, and Chandler standards (“While Yorkville is not looking to adopt Loudoun County’s standards exactly, it aims to implement similar best practices tailored to the City’s specific needs”); Loudoun generator testing hours as tabulated in the memo: May 1 to September 30, 5 to 7 p.m.; October 1 to April 30, 11 a.m. to 5 p.m.; table of twelve data center projects with nearest distance to a residential property line: Cyrus One ~2,230 feet; Prologis (Project Steel) ~3,500 feet; Daniels (South) ~130 feet; Daniels (North) ~98 feet; Green Door 50 acres ~4,300 feet; Green Door-Hagemann ~7,300 feet; Green Door-Kelaka ~1,500 feet; Green Door-Meyer ~0 feet; Hamman-Kelaka ~0 feet; Magnolia Hill Partners ~2,600 feet; Pioneer (Project Cardinal) ~460 feet; PGP Development ~650 feet. Draft ordinance, packet pp. 389 to 393, adopted as Ordinance 2025-53 on June 24, 2025 by a 7-0 roll call (draft minutes of the June 24, 2025 City Council meeting, in the July 22, 2025 City Council Packet, ArchiveCenter Item 6360, p. 20). https://www.yorkville.il.us/ArchiveCenter/ViewFile/Item/6268 (archived: https://web.archive.org/web/20251030032646/https://www.yorkville.il.us/ArchiveCenter/ViewFile/Item/6268) and https://www.yorkville.il.us/ArchiveCenter/ViewFile/Item/6360 (archived: https://web.archive.org/web/20261025162554/https://www.yorkville.il.us/ArchiveCenter/ViewFile/Item/6360)
[11x] United City of Yorkville, Ordinance No. 2025-77, approving the Planned Unit Development Agreement for Project Cardinal, passed November 10, 2025 (7-0), signed by the mayor November 13, 2025, published November 14, 2025; city-posted executed copy, mayor’s signature and clerk’s attestation dated November 13, 2025, Pioneer Development signature and date lines blank. Section 2.1: vesting applies “Upon commencement of the Project within three (3) years of the Effective Date.” Section 2.2: “Section 10-4-10 of the UDO is reserved for additional regulations applicable to Energy Industrial Uses. No new or amended standards, code provisions, or special regulations for Energy Industrial Uses shall apply to the Subject Property during the twenty (20) year vested term from the Effective Date of this Agreement, unless Developer agrees in writing or to the extent required by state or federal law.” No reference to Ordinance 2025-53. Section 2.14: “seventy-eight (78) feet, inclusive of any rooftop mechanical equipment or appurtenances.” Section 3.5: water obligations “addressed exclusively in the Utility Agreement.” https://www.yorkville.il.us/DocumentCenter/View/13587/Ordinance-2025-77—record?bidId= (archived: https://web.archive.org/web/20261025151237/https://www.yorkville.il.us/DocumentCenter/View/13587/Ordinance-2025-77—record?bidId=). Annexation agreement, Ordinance No. 2025-78: https://www.yorkville.il.us/DocumentCenter/View/13588/Ordinance-2025-78—record?bidId= (archived: https://web.archive.org/web/20261025151421/https://www.yorkville.il.us/DocumentCenter/View/13588/Ordinance-2025-78—record?bidId=). Packet version: City Council Packet, November 10, 2025 (ArchiveCenter Item 6499), Planned Unit Development Agreement between the United City of Yorkville and Pioneer Development, LLC (Project Cardinal), packet pp. 272 to 290. Section 2.1: entitlements “fully vested and protected from amendments and changes to City ordinances, codes, or regulations for a period of twenty (20) years from the Effective Date.” Section 2.2: “No new or amended standards, code provisions, or special regulations for Energy Industrial Uses shall apply to the Subject Property during the twenty (20) year vested term from the Effective Date of this Agreement, unless Developer agrees in writing or to the extent required by state or federal law.” Section 2.3: approximately ten-year build-out; Phasing Plan “advisory only and non-binding.” Section 2.4: “All data center buildings shall be at least five hundred feet (500′) from the nearest residential or commercial structure outside the boundaries of the Subject Property,” measured “from existing, occupied, residential or commercial buildings as of the date of PUD approval.” Section 2.10: 100-foot Transition Zone Type D buffer with a 12-foot berm facing residential properties and 8 feet elsewhere; “No additional berms or landscape requirements shall be imposed unless Developer agrees in writing.” Section 2.11: “the most appropriate location for Mechanical Equipment is on the rooftops; therefore, whenever practical, mechanical equipment shall be placed on the rooftops”; project subject to the City Noise Ordinance “as it existed when the PUD application was approved by the City Council.” Section 2.14: 78-foot maximum height including rooftop equipment. Section 2.17: “all primary power used for the data center campus on the Subject Property will be delivered from the Commonwealth Edison power grid” unless the City Council approves otherwise. Section 3.4: continuous noise monitoring devices at the onset of each construction phase, a preliminary report within 60 days after each building is operational, devices maintained for the life of the project. Section 3.11: operational testing of generators “during the hours of 11:00 a.m. to 5:00 p.m., Monday through Friday, and not on any Holidays.” https://www.yorkville.il.us/ArchiveCenter/ViewFile/Item/6499 (archived: https://web.archive.org/web/20261025154939/https://www.yorkville.il.us/ArchiveCenter/ViewFile/Item/6499)
[11b] United City of Yorkville, Ordinance No. 2025-53, data center standards, passed June 24, 2025 (7-0), published June 27, 2025, replacing Unified Development Ordinance Section 10-4-10 in its entirety: https://www.yorkville.il.us/DocumentCenter/View/13005/Ordinance-2025-53?bidId= (archived: https://web.archive.org/web/20261025151332/https://www.yorkville.il.us/DocumentCenter/View/13005/Ordinance-2025-53?bidId=). As codified, UDO Section 10-4-10, history note “(Ord. No. 2025-53, effective 06/27/2025)”: initial noise study with baseline measurements and predictive modeling; final study on “actual sound level measurements”; mitigation plan “including the penalty for tonal equipment”; annual monitoring by the city’s consultant for three years or, alternatively, continuous monitors from the onset of construction; rooftop HVAC or mechanical units “shall require the approval of City Council”; 70-foot height including rooftop equipment within 1,500 feet of a residence; generator testing 11 a.m. to 5 p.m. weekdays, non-holidays; 50-foot battery setback; 500-foot building separation; 100-foot landscape buffers. No water or well provisions. https://online.encodeplus.com/regs/yorkville-il/doc-viewer.aspx?secid=290 (archived: https://web.archive.org/web/20261025034754/https://online.encodeplus.com/regs/yorkville-il/doc-viewer.aspx?secid=290). UDO Section 10-7-6.A: “All parcels within a subdivision shall be required to connect to the United City of Yorkville’s Public Water Supply System.” https://online.encodeplus.com/regs/yorkville-il/doc-viewer.aspx?secid=326 (archived: https://web.archive.org/web/20261025034848/https://online.encodeplus.com/regs/yorkville-il/doc-viewer.aspx?secid=326)
[11y] United City of Yorkville, Planning and Zoning Commission, transcript of the public hearing on PZC 2025-08 (Pioneer Development, LLC, Project Cardinal), July 9, 2025, Vitosh Reporting Service (ArchiveCenter Item 6395, “PZC 7-9-25 Minutes & Transcript”). Sworn testimony of Matt McCarron for Pioneer Development: Ashburn homes “within 500 feet of data center campuses in Ashburn have been appreciated by approximately 70 percent over the last decade” (transcript p. 26); “legacy Ashburn data center campuses are built as close as a hundred, 130 feet from residential property lines. We’re committing to a minimum 500-foot setback” (pp. 26 to 27); generator testing “is only going to occur once or twice a year” and generators “are really never used outside of testing” (p. 25); “all backup generators meet Tier 4 final EPA standards” (p. 29); “if it’s curtailed in an emergency, we would be curtailed first and we would have backup generators. We are not going to cause a brownout” (p. 84). https://www.yorkville.il.us/ArchiveCenter/ViewFile/Item/6395 (archived: https://web.archive.org/web/20261025162533/https://www.yorkville.il.us/ArchiveCenter/ViewFile/Item/6395)
[11z] Yorkville water and project timing, read October 24, 2026. CyrusOne, Yorkville Technology Campus page (company source): “The first building is expected to be completed in late 2027, with full operations beginning in 2028.” https://www.cyrusone.com/data-centers/north-america/yorkville-technology-campus (archived: https://web.archive.org/web/20261025155012/https://www.cyrusone.com/data-centers/north-america/yorkville-technology-campus). Joey Weslo, Shaw Local, June 8, 2026: Project Cardinal’s developers asked to extend the land-acquisition deadline from July 1, 2026 to December 31, 2027. https://shawlocal.com/kendall-county-now/2026/06/08/developers-of-project-cardinal-data-center-in-yorkville-ask-for-18-month-extension-to-purchase-land (archived: https://web.archive.org/web/20261025155634/https://shawlocal.com/kendall-county-now/2026/06/08/developers-of-project-cardinal-data-center-in-yorkville-ask-for-18-month-extension-to-purchase-land). Joey Weslo, Shaw Local, June 17, 2026: Lake Michigan water “expected to be online for Yorkville by the summer of 2028.” https://shawlocal.com/kendall-county-now/2026/06/17/yorkvilles-170-million-federal-epa-loan-for-lake-michigan-water-project-stuck-in-limbo/ (archived: https://web.archive.org/web/20260831050426/https://shawlocal.com/kendall-county-now/2026/06/17/yorkvilles-170-million-federal-epa-loan-for-lake-michigan-water-project-stuck-in-limbo/) [11e] Shaw Local (Kendall County Now), “Developers of Project Cardinal data center in Yorkville ask for 18-month extension to purchase land,” June 8, 2026. City memorandum of understanding penalty structure: average of 42,000 gallons per day across a billing cycle, 71,400 gallons on a single day, penalties imposed for exceeding either; primary document now cited as [11o]. https://www.shawlocal.com/kendall-county-now/2026/06/08/developers-of-project-cardinal-data-center-in-yorkville-ask-for-18-month-extension-to-purchase-land/ (archived: https://web.archive.org/web/20261025155634/https://www.shawlocal.com/kendall-county-now/2026/06/08/developers-of-project-cardinal-data-center-in-yorkville-ask-for-18-month-extension-to-purchase-land/)
[11f] WSPY News, “City council gives green light to 550-acre data center campus,” March 2026 (Project Steel, Prologis). Developers’ stated figures: approximately 25,000 gallons per day average, approximately 42,500 gallons per day on peak days. These figures describe Project Steel, a separate Yorkville proposal, and should not be applied to Project Cardinal. https://www.wspynews.com/news/local/city-council-gives-green-light-to-550-acre-data-center-campus/article_451023a9-3ea1-4cac-846f-49e90b117ab9.html (archived: https://web.archive.org/web/20260909023807/https://www.wspynews.com/news/local/city-council-gives-green-light-to-550-acre-data-center-campus/article_451023a9-3ea1-4cac-846f-49e90b117ab9.html)
[11g] Shaw Local, “Questions arise over data centers’ water use, Illinois considers mandating water-efficient cooling systems,” July 10, 2026. “At full build-out, the Project Cardinal data center in Yorkville will use the same amount of water each day as 141 homes.” Restates the Yorkville penalty structure: 71,400 gallons on any particular day, 42,000 gallons per day average across a billing cycle. https://www.shawlocal.com/news/2026/07/10/questions-arise-over-data-centers-water-usage-illinois-considers-mandating-water-efficient-cooling-systems/ (archived: https://web.archive.org/web/20260923145043/https://www.shawlocal.com/news/2026/07/10/questions-arise-over-data-centers-water-usage-illinois-considers-mandating-water-efficient-cooling-systems/)
[11h] Shaw Local (Kendall County Now), “‘Nobody wants to live in data center row’ – Residents speak out after Yorkville approves 540-acre data center,” March 26, 2026. City Administrator Bart Olson on Project Steel: air-cooled, approximately 25,000 to 42,400 gallons per day; 25,000 gpd characterized as “the equivalent water usage of 90 to 120 homes.” Recounting aldermen’s questions, describes Project Cardinal as one “which will be using zero municipal water” and “trucking in its own water for a closed-loop system.” Also reports 3,016 acres slated for data center development along the Eldamain Corridor across roughly a dozen separate projects approved, under review, or in site inquiry. https://www.shawlocal.com/kendall-county-now/2026/03/26/nobody-wants-to-live-in-data-center-row-residents-speak-out-after-yorkville-approves-540-acre-data-center/ (archived: https://web.archive.org/web/20260802044039/https://www.shawlocal.com/kendall-county-now/2026/03/26/nobody-wants-to-live-in-data-center-row-residents-speak-out-after-yorkville-approves-540-acre-data-center/)
[11i] Shaw Local (Kendall County Now), “228-acre CyrusOne data center agrees to pay Yorkville $15 million up-front, city imposes water use limits,” July 14, 2026. CyrusOne initially projected at 500,000 gallons per day, reduced to a maximum of 40,000 gallons per day under city-imposed limits; average home water consumption reported at around 300 gallons per day. https://www.shawlocal.com/kendall-county-now/2026/07/14/228-acre-cyrusone-data-center-agrees-to-pay-yorkville-15-million-up-front-city-imposes-water-use-limits/ (archived: https://web.archive.org/web/20260920210417/https://www.shawlocal.com/kendall-county-now/2026/07/14/228-acre-cyrusone-data-center-agrees-to-pay-yorkville-15-million-up-front-city-imposes-water-use-limits/)
[11k] Shaw Local (Kendall County Now), “Yorkville close to reaching settlement on resident’s lawsuit over 1,037 acre data center,” March 21, 2026, and Yorkville Herald, “Yorkville Council to Consider Settlement in Project Cardinal Lawsuit,” June 19, 2026. Resident John Bryan filed suit October 28, 2025 alleging noise and property value harm; Pioneer Development LLC intervened as a defendant December 19, 2025; the June 23, 2026 council agenda included a conditional settlement requiring that “each phase of the project is substantially complete before construction of the next phase begins,” “with limited exceptions for circumstances beyond the developer’s control.” https://www.shawlocal.com/kendall-county-now/2026/03/21/yorkville-close-to-reaching-settlement-on-residents-lawsuit-over-1037-acre-data-center/ (archived: https://web.archive.org/web/20260804170512/https://www.shawlocal.com/kendall-county-now/2026/03/21/yorkville-close-to-reaching-settlement-on-residents-lawsuit-over-1037-acre-data-center/) and https://www.yorkvilleherald.com/articles/yorkville-council-to-consider-settlement-in-project-cardinal-lawsuit (archived: https://web.archive.org/web/20260908214340/https://www.yorkvilleherald.com/articles/yorkville-council-to-consider-settlement-in-project-cardinal-lawsuit)
[11l] CBS Chicago, “Yorkville residents file lawsuit seeking to stop massive data center project,” April 29, 2026, and “Yorkville farm, residents sue to stop second massive data center project,” May 29, 2026. Preserve Our Yorkville & Community LLC allegations: rezoning of more than 1,000 acres from residential to industrial without a noise analysis, traffic impact study, or analysis of cooling water consumption, and without proper notice to property owners within 500 feet; second suit challenges the Project Steel approval on parallel notice grounds. Allegations are unadjudicated. https://www.cbsnews.com/chicago/news/yorkville-data-center-lawsuit-pioneer-development/ (archived: https://web.archive.org/web/20260916192849/https://www.cbsnews.com/chicago/news/yorkville-data-center-lawsuit-pioneer-development/) and https://www.cbsnews.com/chicago/news/yorkville-farm-lawsuit-second-massive-data-center-project/ (archived: https://web.archive.org/web/20260924214603/https://www.cbsnews.com/chicago/news/yorkville-farm-lawsuit-second-massive-data-center-project/)
[11j] WSPY News, “Yorkville Data Centers To Use 200 Million Gallons of Water Annually At Full Buildout,” June 23, 2025 (updated June 25, 2025), reporting the City of Yorkville’s presentation on proposed data centers: all currently proposed data centers combined projected at approximately 200 million gallons per year at full development, against a city processing over 800 million gallons annually. City Administrator Bart Olson: if the data centers are built before the Lake Michigan pipeline is completed, “they will use Yorkville’s well water in the interim.” https://www.wspynews.com/news/local/yorkville-data-centers-to-use-200-million-gallons-of-water-annually-at-full-buildout/article_9437e342-81cf-464f-b020-9e7ac2bcedd2.html (archived: https://web.archive.org/web/20260908191718/https://www.wspynews.com/news/local/yorkville-data-centers-to-use-200-million-gallons-of-water-annually-at-full-buildout/article_9437e342-81cf-464f-b020-9e7ac2bcedd2.html)
[12] Alex Baumhardt, Oregon Capital Chronicle, republished by Oregon Public Broadcasting, “Amazon to pay $20.5 million settlement over northeast Oregon nitrate pollution,” March 31, 2026. Pearson v. Port of Morrow, U.S. District Court, filed February 2024; Amazon “one of 17 total defendants, including 10 previously unnamed ones”; class status sought for Morrow and Umatilla county residents; port wastewater “used to cool computer servers,” which “further elevat[es] the concentration of nitrate it holds before also being end-use applied to area farm fields”; Amazon spokesperson denial; settlement with no admission of liability; plaintiffs’ attorney Steve Berman on continuing the case against other defendants. https://www.opb.org/article/2026/03/31/amazon-fine-northeast-oregon-boardman-nitrate-pollution-well/ (archived: https://web.archive.org/web/20261025160214/https://www.opb.org/article/2026/03/31/amazon-fine-northeast-oregon-boardman-nitrate-pollution-well/)
[12a] Congressional Research Service, “Data Centers and Water: Frequently Asked Questions,” R49057, July 31, 2026. Blowdown and discharge composition (total dissolved solids, chlorine, corrosion inhibitors, biocides, copper, nickel, chromium, pH, temperature; some additives proprietary); data centers most commonly discharge to publicly owned treatment works under the National Pretreatment Program; “EPA has not established ELGs for data centers, so categorical pretreatment standards do not apply”; data centers not typically classified as significant industrial users because cooling system blowdown is excluded from flow-based thresholds; direct-discharge NPDES limits typically set on best professional judgment; construction and maintenance slug loads; public water systems supply an estimated 97% of U.S. data center water; no facility-level discharge figures given. Canonical: https://www.congress.gov/crs-product/R49057 (archived: https://web.archive.org/web/20260824154654/https://www.congress.gov/crs-product/R49057). Readable copy: https://www.everycrsreport.com/reports/R49057.html (archived: https://web.archive.org/web/20260926130247/https://www.everycrsreport.com/reports/R49057.html)
[12b] U.S. EPA, “Water Efficiency Management Guide: Mechanical Systems,” EPA 832-F-17-016c, November 2017 (WaterSense at Work). Cooling tower water balance: makeup equals evaporation plus blowdown (drift and leaks negligible); cycles of concentration equals makeup divided by blowdown; increasing cycles from three to six reduces water use by about 20%. https://www.epa.gov/sites/default/files/2017-12/documents/ws-commercialbuildings-waterscore-mechanical-systems-guide.pdf (archived: https://web.archive.org/web/20260103012643/https://www.epa.gov/sites/default/files/2017-12/documents/ws-commercialbuildings-waterscore-mechanical-systems-guide.pdf)
[12c] 35 Ill. Adm. Code 310.112, “Significant Industrial User.” Three tests beyond categorical standards: average discharge of 25,000 gallons per day or more of process wastewater to the POTW “(excluding sanitary, noncontact cooling, and boiler blowdown wastewater)”; a process wastestream “which makes up five percent or more of the average dry weather hydraulic or organic capacity of the POTW treatment plant”; or designation “by the Control Authority on the basis that the industrial user has a reasonable potential for adversely affecting the POTW’s operation or for violating any pretreatment standard or requirement.” https://ilga.gov/ftp/JCAR/AdminCode/035/035003100A01120R.html (archived: https://web.archive.org/web/20261025155933/https://ilga.gov/ftp/JCAR/AdminCode/035/035003100A01120R.html)
[12d] Ohio EPA, Draft General NPDES Permit No. OHD000001 for discharges from data center facilities to waters of the state, Public Notice issued October 31, 2025, written comments through December 17, 2025, public hearing December 17, 2025. https://dam.assets.ohio.gov/image/upload/epa.ohio.gov/Portals/35/permits/Data_Centers/OHD000001_Draft_PN.pdf (archived: https://web.archive.org/web/20260407094842/http://dam.assets.ohio.gov/image/upload/epa.ohio.gov/Portals/35/permits/Data_Centers/OHD000001_Draft_PN.pdf). Fact sheet: eligible discharges (noncontact cooling water, cooling tower blowdown, boiler blowdown, air compressor condensate); limits for pH and total filterable residue from Ohio water quality criteria; conditional total residual chlorine and oxidant limits; monitoring for temperature and flow; Ohio EPA approval required for bromine-, chlorine-, and phosphorus-releasing treatment additives; exclusions for high-quality receiving waters and for surface water intakes of 2 MGD or more. https://dam.assets.ohio.gov/image/upload/epa.ohio.gov/Portals/35/permits/Data_Centers/OHD000001_Draft.fs.pdf (archived: https://web.archive.org/web/20260926130249/https://dam.assets.ohio.gov/image/upload/epa.ohio.gov/Portals/35/permits/Data_Centers/OHD000001_Draft.fs.pdf) Summary of scope: Bricker Graydon LLP (law firm), “Ohio EPA Issues Draft General NPDES Permit for Data Centers,” December 2, 2025: covers discharges “to waters of the state”; excludes discharges to combined or sanitary sewer systems and to ground water. https://www.bricker.com/insights/publications/ohio-epa-issues-draft-general-npdes-permit-for-data-centers (archived: https://web.archive.org/web/20260513031736/https://www.bricker.com/insights/publications/ohio-epa-issues-draft-general-npdes-permit-for-data-centers)
[12e] Christian Thorsberg, Circle of Blue, “Ohio Scraps Controversial Plan to Ease Data Center Wastewater Discharges,” July 22, 2026. Ohio EPA: “Ohio EPA has decided not to move forward with finalizing the general permit”; more than 7,000 public comments; data center discharge permits to continue on an individual basis. https://www.circleofblue.org/2026/supply/water-quality/ohio-scraps-controversial-plan-to-ease-data-center-wastewater-discharges/ (archived: https://web.archive.org/web/20261025155644/https://www.circleofblue.org/2026/supply/water-quality/ohio-scraps-controversial-plan-to-ease-data-center-wastewater-discharges/)
[12f] 40 CFR 403.5, National pretreatment standards: prohibited discharges. (a)(1): “A User may not introduce into a POTW any pollutant(s) which cause Pass Through or Interference.” (b)(1): wastestreams with “a closed cup flashpoint of less than 140 degrees Fahrenheit”; (b)(2): “in no case Discharges with pH lower than 5.0”; (b)(5): heat that inhibits biological activity, and “in no case” such that “the temperature at the POTW Treatment Plant exceeds 40 °C (104 °F)” without approval; (b)(8): “Any trucked or hauled pollutants, except at discharge points designated by the POTW.” (c): POTWs with approved pretreatment programs “shall develop and enforce specific limits” implementing the prohibitions. https://www.law.cornell.edu/cfr/text/40/403.5 (archived: https://web.archive.org/web/20260215053414/https://www.law.cornell.edu/cfr/text/40/403.5)
[13] Politico / E&E News, “A data center drained 30M gallons of water unnoticed – until residents complained about low water pressure,” May 9-10, 2026. Primary document: Fayette County water system letter to QTS, May 15, 2025 (obtained via public records request; not published), as reported. Bill: “owed nearly $150,000 for using more than 29 million gallons of unaccounted-for water”; campus “covering 615 acres with plans for up to 16 buildings.” Water system director Vanessa Tigert: “They’re our largest customer, and we have to be partners”; Tigert estimated the unbilled period at about four months, a QTS spokesperson at nine to 15 months. https://www.eenews.net/articles/georgia-residents-seethe-over-30m-gallons-of-missing-water/ (archived: https://web.archive.org/web/20261024150601/https://www.eenews.net/articles/georgia-residents-seethe-over-30m-gallons-of-missing-water/)
[13a] The Citizen (Fayetteville, GA), “Behind Fayette’s QTS Water Controversy: A Missed Meter, 8,000 Workers and a Massive Construction Project,” May 11, 2026. County Administrator Steve Rapson and Assistant County Administrator Jason Tinsley on the record attributing the issue to a missed meter reading during the county’s transition of roughly 33,000 meters to Advanced Metering Infrastructure, not unauthorized installation; confirms staff inspected the meter during construction; Rapson: the City of Fayetteville is the only current customer using more water than QTS, and “After these buildings are built, QTS won’t even be on my top 10.” https://thecitizen.com/2026/05/11/behind-fayettes-qts-water-controversy-a-missed-meter-8000-workers-and-a-massive-construction-project/ (archived: https://web.archive.org/web/20260806062710/https://thecitizen.com/2026/05/11/behind-fayettes-qts-water-controversy-a-missed-meter-8000-workers-and-a-massive-construction-project/). Atlanta News First (WTVM/WSB), “Records raise questions about Georgia’s largest data center and its water use,” July 13, 2026, reporting the county’s formal public statement retracting the “unauthorized” framing: “Our letter was unclear, which caused misunderstandings about how much water QTS is allowed to use.” https://www.wtvm.com/2026/07/13/records-raise-questions-about-georgias-largest-data-center-its-water-use/ (archived: https://web.archive.org/web/20260723073526/https://www.wtvm.com/2026/07/13/records-raise-questions-about-georgias-largest-data-center-its-water-use/)
[13b] Fayette County, Georgia, “Facts about the QTS Fayetteville Data Center Campus Project,” May 13, 2026. “Our letter on May 15, 2025, was unclear, which caused misunderstandings about how much water QTS is allowed to use”; some meters “were still connected to the old system and not linked to the new digital system for billing or usage tracking” during the upgrade of 33,000 customer meters to Advanced Metering Infrastructure; QTS “was immediately billed at the $6.46/per 1,000 gallons construction rate,” “double the normal retail rate for past water use”; QTS monthly usage “less than 1%” of current production. https://fayettecountyga.gov/news_detail_T2_R185.php (archived: https://web.archive.org/web/20261008100925/https://fayettecountyga.gov/news_detail_T2_R185.php) [14] Industrial Noise and Vibration Centre, “Silencing also improved data center fan noise efficiency by 20 percent,” case study. [Source is the vendor who performed the work; independently published peer review does not exist for this specific result.] https://invc.com/resources/noise-control-case-studies/fans/data-center-fan-noise-attenuation-increases-efficiency-20/ (archived: https://web.archive.org/web/20260707112501/https://invc.com/resources/noise-control-case-studies/fans/data-center-fan-noise-attenuation-increases-efficiency-20/)
[14a] Sailor, D.J., Abolhassani, S.S., and Martin, E., “Data Center Waste Heat as an Emerging Urban Thermal Hazard: First Field Measurements of Neighborhood-Scale Air Temperature Impacts,” ASME Journal of Engineering for Sustainable Buildings and Cities, Vol. 7, No. 2, May 2026. https://asmedigitalcollection.asme.org/sustainablebuildings/article/7/2/024501/1233035/Data-Center-Waste-Heat-as-an-Emerging-Urban (archived: https://web.archive.org/web/20261005124524/https://asmedigitalcollection.asme.org/sustainablebuildings/article/7/2/024501/1233035/Data-Center-Waste-Heat-as-an-Emerging-Urban) The journal page sits behind a bot check and was not read directly; study details are confirmed through Interesting Engineering, May 18, 2026: four facilities from a 36 MW Mesa building to a 169 MW Chandler campus; June 18 to October 25, 2025; vehicle-mounted sensors with simultaneous upwind and downwind readings; up to 4°F, average 1.3 to 1.6°F; primarily air-cooled, condenser discharge 14 to 25°F above ambient; detectable up to a third of a mile; “the first to directly measure air temperatures both upwind and downwind of data centers in real time.” https://interestingengineering.com/science/data-center-phoenix-temperature (archived: https://web.archive.org/web/20260519113752/https://interestingengineering.com/science/data-center-phoenix-temperature)
[14b] Marinoni, A., Cambria, E., Lin, W., et al., “The data heat island effect: quantifying the impact of AI data centers in a warming world,” arXiv:2603.20897, submitted March 21, 2026, revised April 21, 2026 (v3). Not peer-reviewed. Abstract: land surface temperature “increases by 2°C on average after the start of operations”; “more than 340 million people could be affected.” Full text: impact “reaches up to 10 km distance”; “an average monthly LST increase of 1 °C can be measured up to 4.5 km”; filtering for “seasonality effects” and “other types of anthropogenic activities in the surrounding of AI hyperscalers”; “over 6733 data points.” https://arxiv.org/abs/2603.20897 (archived: https://web.archive.org/web/20261013004906/https://arxiv.org/abs/2603.20897)
[15a] U.S. EPA, “Designation of Perfluorooctanoic Acid (PFOA) and Perfluorooctanesulfonic Acid (PFOS) as CERCLA Hazardous Substances,” Final Rule, effective July 8, 2024. MCLs for PFOA and PFOS set at 4.0 parts per trillion under the concurrent PFAS National Primary Drinking Water Regulation (April 10, 2024). https://www.epa.gov/superfund/designation-perfluorooctanoic-acid-pfoa-and-perfluorooctanesulfonic-acid-pfos-cercla (archived: https://web.archive.org/web/20261002070559/https://www.epa.gov/superfund/designation-perfluorooctanoic-acid-pfoa-and-perfluorooctanesulfonic-acid-pfos-cercla)
[15b] Pillsbury Winthrop Shaw Pittman LLP, PFAS Observer, “PFAS, HFCs and Related Chemicals in the Data Center Industry,” May 2, 2025 (cross-posted on Gravel2Gavel). “Historically, dry pipe fire suppression systems have used Class B aqueous film-forming foams (AFFF)”; activation “may result in the sudden discharge of large quantities of PFAS-containing AFFF.” https://pfas.pillsburylaw.com/pfas-hfcs-chemicals-data-center-industry/ (archived: https://web.archive.org/web/20261025155111/https://pfas.pillsburylaw.com/pfas-hfcs-chemicals-data-center-industry/)
[15c] U.S. EPA, Office of Emergency Management, “The SPCC Rule and Recent Amendments,” November 2010 (SPCC basics). Applicability to facilities storing more than 1,320 gallons of oil aboveground with a reasonable expectation of a discharge to navigable waters; secondary containment under 40 CFR 112.7(c) sized to “the typical failure mode, and the most likely quantity of oil that would be discharged”; qualified-facility self-certification available at “10,000 U.S. gallons or less in aggregate aboveground oil storage capacity,” with Professional Engineer certification otherwise. https://www.epa.gov/sites/default/files/2014-05/documents/spcc_basics.pdf (archived: https://web.archive.org/web/20260219022141/https://www.epa.gov/sites/default/files/2014-05/documents/spcc_basics.pdf). Rule text: 40 CFR Part 112.
[15d] U.S. EPA, “Rescission of Regulatory Determinations and Removal of Related Provisions for Four PFAS Substances,” proposed rule, 91 FR 29413, May 20, 2026, FR Doc. 2026-10085, docket EPA-HQ-OW-2025-0654: would rescind the determinations for PFHxS, PFNA, HFPO-DA, and “mixtures of these three PFAS plus perfluorobutane sulfonic acid (PFBS)”; “This action does not impact the MCLGs, MCLs or the regulatory provisions” for PFOA and PFOS. https://www.federalregister.gov/documents/2026/05/20/2026-10085/rescission-of-regulatory-determinations-and-removal-of-related-provisions-for-four-pfas-substances (archived: https://web.archive.org/web/20261016032522/https://www.federalregister.gov/documents/2026/05/20/2026-10085/rescission-of-regulatory-determinations-and-removal-of-related-provisions-for-four-pfas-substances). U.S. EPA, “Extending the Compliance Deadline for the PFOA and PFOS Maximum Contaminant Levels,” proposed rule, 91 FR 29425, May 20, 2026, FR Doc. 2026-10086, docket EPA-HQ-OW-2025-1742: compliance moved “from April 26, 2029, to April 26, 2031” for systems that submit a request, through a federal exemption under SDWA section 1416(f). https://www.federalregister.gov/documents/2026/05/20/2026-10086/extending-the-compliance-deadline-for-the-pfoa-and-pfos-maximum-contaminant-levels (archived: https://web.archive.org/web/20261007222507/https://www.federalregister.gov/documents/2026/05/20/2026-10086/extending-the-compliance-deadline-for-the-pfoa-and-pfos-maximum-contaminant-levels). EPA proposal page, MCLs “remain 4.0 parts per trillion (ppt) each”: https://www.epa.gov/sdwa/proposed-pfoa-and-pfos-compliance-extension-rule (archived: https://web.archive.org/web/20261016195758/https://www.epa.gov/sdwa/proposed-pfoa-and-pfos-compliance-extension-rule). Comment periods closed July 20, 2026; no final action found as of October 24, 2026.
[16] Uptime Institute, “Annual Outage Analysis 2025,” May 6, 2025. https://uptimeinstitute.com/about-ui/press-releases/uptime-announces-annual-outage-analysis-report-2025 (archived: https://web.archive.org/web/20260701002954/https://uptimeinstitute.com/about-ui/press-releases/uptime-announces-annual-outage-analysis-report-2025)
[16a] NFPA, “NFPA 855, Standard for the Installation of Stationary Energy Storage Systems.” Becomes legally enforceable when adopted by the applicable state or local authority having jurisdiction, as with other NFPA standards. UL, “UL 9540A Test Method for Evaluating Thermal Runaway Fire Propagation in Battery Energy Storage Systems,” a test method used to characterize fire propagation risk rather than a standalone regulatory requirement; UL 9540 is the separate product safety standard for energy storage systems. https://www.nfpa.org/codes-and-standards/nfpa-855-standard-development/855 (archived: https://web.archive.org/web/20261017191038/https://www.nfpa.org/codes-and-standards/nfpa-855-standard-development/855) and https://www.ul.com/services/ul-9540a-test-method (archived: https://web.archive.org/web/20261025155719/https://www.ul.com/services/ul-9540a-test-method)
[17] Tom Kertscher, Wisconsin Watch, “Local data center critics praise Microsoft’s pledge to stop using NDAs, but remain skeptical,” March 23, 2026. Microsoft’s commitment to stop signing nondisclosure agreements and to work with local governments to end existing ones; one existing NDA in Kenosha noted. https://wisconsinwatch.org/2026/03/local-data-center-critics-praise-microsofts-pledge-to-stop-using-ndas-but-remain-skeptical/ (archived: https://web.archive.org/web/20261024145624/https://wisconsinwatch.org/2026/03/local-data-center-critics-praise-microsofts-pledge-to-stop-using-ndas-but-remain-skeptical/) Primary: Microsoft Local, “Putting communities first: Our decision to end NDAs with local governments,” March 18, 2026 (“Microsoft has made the decision to end the use of nondisclosure agreements (NDAs) with local governments”; working “to identify any active NDAs in place globally”; in limited circumstances it may share confidential trade secrets such as design specifications needed for permits and will “still seek to protect such information from records disclosure” where the law allows). https://local.microsoft.com/blog/putting-communities-first-our-decision-to-end-ndas-with-local-governments/ (archived: https://web.archive.org/web/20261012043134/https://local.microsoft.com/blog/putting-communities-first-our-decision-to-end-ndas-with-local-governments/)
[17a] Tom Kertscher, Wisconsin Watch, “At least four Wisconsin communities signed secrecy deals for billion-dollar data centers,” January 26, 2026. Beaver Dam Area Development Corp. NDA with Balloonist LLC, December 1, 2023 (Meta later identified); Menomonie with Balloonist LLC, February 2024; Kenosha with Microsoft, May 2024; Janesville, 2025. https://wisconsinwatch.org/2026/01/wisconsin-data-center-secrecy-deals-nda-nondisclosure-agreement/ (archived: https://web.archive.org/web/20260915192341/https://wisconsinwatch.org/2026/01/wisconsin-data-center-secrecy-deals-nda-nondisclosure-agreement/)
[17b] Amazon, “Amazon’s approach to data centers: community-focused, sustainable and efficient” (Built Together announcement), October 2, 2026: “We no longer use nondisclosure agreements with the government agencies we work with on our projects”; “We will utilize backup generators in new sites that meet the EPA’s Tier 4 emissions standards … or the equivalent standards in other regions”; “much of the industry now uses Tier 4 emission controls.” https://www.aboutamazon.com/news/company-news/amazon-data-centers-built-together (archived: https://web.archive.org/web/20261025155231/https://www.aboutamazon.com/news/company-news/amazon-data-centers-built-together). Scope as reported: GeekWire, October 2, 2026, the change applies going forward and Amazon does not plan to revisit past agreements, https://www.geekwire.com/2026/amazon-pledges-1b-to-data-center-communities-warns-that-local-opposition-threatens-u-s-ai-lead/ (archived: https://web.archive.org/web/20261016023634/https://www.geekwire.com/2026/amazon-pledges-1b-to-data-center-communities-warns-that-local-opposition-threatens-u-s-ai-lead/); DatacenterDynamics, October 2, 2026, the announcement did not address shell companies or project codenames, https://www.datacenterdynamics.com/en/news/aws-drops-non-disclosure-agreements-for-data-center-projects/ (archived: https://web.archive.org/web/20261005065258/https://www.datacenterdynamics.com/en/news/aws-drops-non-disclosure-agreements-for-data-center-projects/) [18b] Senator Richard Blumenthal, Ranking Member, Senate Permanent Subcommittee on Investigations, press release, “Blumenthal Investigates Big Tech’s Use of Non-Disclosure Agreements to Conceal Impact of Energy Guzzling Data Centers,” March 31, 2026. Letters to public utility regulators in all 50 states; cites University of Mary Washington researchers’ finding that in Virginia localities where a data center could be identified, “the vast majority (25 out of 31) of local governments are operating under an NDA.” https://www.blumenthal.senate.gov/newsroom/press/release/blumenthal-investigates-big-techs-use-of-non-disclosure-agreements-to-conceal-impact-of-energy-guzzling-data-centers (archived: https://web.archive.org/web/20261024145705/https://www.blumenthal.senate.gov/newsroom/press/release/blumenthal-investigates-big-techs-use-of-non-disclosure-agreements-to-conceal-impact-of-energy-guzzling-data-centers)
[19] LoudounNow (Hanna Pampaloni), “DEQ Launches Air Quality Monitoring in Ashburn’s Data Center Alley,” April 30, 2026. First phase began February 2026 with five sensors in eastern Loudoun; data collection began March 3; two more sensors added in April; PM2.5, carbon monoxide, and nitrogen dioxide; EPA grant funded. https://www.loudounnow.com/news/deq-launches-air-quality-monitoring-in-ashburn-s-data-center-alley/article_3e4aea6b-24bc-45fb-9f5e-4b5a1578fb23.html (archived: https://web.archive.org/web/20261025155322/https://www.loudounnow.com/news/deq-launches-air-quality-monitoring-in-ashburn-s-data-center-alley/article_3e4aea6b-24bc-45fb-9f5e-4b5a1578fb23.html)
[19a] Virginia Department of Environmental Quality, “Stationary Source Assessment (SSA) Response to Health Impact Claims Related to the Vantage Data Centers VA2 Facility,” April 27, 2026, 18 pp. Facility: Vantage Data Centers VA2, 22435 Glenn Drive, Loudoun County; minor NSR permit issued September 15, 2023 for 40 emergency and 2 black start diesel gen-sets and 8 natural gas combustion turbines serving as primary power (pp. 3-4); 2025 actual emissions as a percent of permit limits: PM2.5 69%, NOx 47%, SO2 69%, CO 49%, VOC 28% (Table 3, p. 5); PEC report used single-year 2023 ambient data, 2024 about 25% lower (p. 6); InMAP not EPA-approved, single aggregated source although units have dedicated stacks and do not operate simultaneously except during maintenance (pp. 4, 9-10); InMAP overpredicted by a factor of at least 5 in one DEQ comparison (p. 11); COBRA-based estimates “overstated by at least an order of magnitude and likely more” (p. 12); “DEQ has no expertise in this field” of health impact calculations (p. 15); Loudoun health rankings data inclusive of 2023 (pp. 16-17); Vantage plan to shut down turbines and connect to grid (p. 17). https://www.deq.virginia.gov/home/showpublisheddocument/35701 (archived: https://web.archive.org/web/20261024150757/https://www.deq.virginia.gov/home/showpublisheddocument/35701)
[19b] EmPower Analytics Group LLC (Michael Cork, PhD, MPH, and Francesca Dominici, PhD), “Air Quality, Health, and Economic Impacts of the Vantage Data Center Facility,” prepared for the Piedmont Environmental Council, February 27, 2026 [advocacy-commissioned]. Executive summary: “The analysis reflects operation at the facility’s maximum permitted annual emission limits”; $53 to $99 million per year in health-related damages and an estimated 3.4 to 6.5 additional premature deaths per year. Methods: “the analysis does not attempt to predict typical operating conditions, dispatch patterns, or short-term variability”; emissions “represented as a single, aggregated elevated point source.” https://www.pecva.org/wp-content/uploads/Health-Impacts-Vantage-Data-Center-Report-2.pdf (archived: https://web.archive.org/web/20261010214838/https://www.pecva.org/wp-content/uploads/Health-Impacts-Vantage-Data-Center-Report-2.pdf)
[19c] Ariel Wittenberg, E&E News, “Emails show how Virginia regulators downplayed data center health concerns,” July 24, 2026. Agency emails on DEQ’s review of the PEC/Cork report: director’s receipt of the report about two days before its March 4 release and request for review, a staff preliminary critique less than three hours after publication, and the director’s “wants to criticize DEQ” email after staff comments on March 5; staff statements that health assessment was outside their expertise (“We aren’t qualified to do that review”); DEQ final report placing Vantage’s actual emissions at 28% to 69% of permit limits; population-health ranking based on 2023 data predating the facility’s operation, and former DEQ director Robert Burnley’s criticism of that statement; Cork’s statement that he reran his analysis on DEQ’s observed emissions, estimating $33 million to $63 million in annual health damages and two to four premature deaths; DEQ spokesperson statement that staff did not collaborate with PEC, Vantage, or other external participants. https://www.eenews.net/articles/emails-show-how-virginia-regulators-downplayed-data-center-health-concerns/ (archived: https://web.archive.org/web/20261024145907/https://www.eenews.net/articles/emails-show-how-virginia-regulators-downplayed-data-center-health-concerns/)
[20] Shaddox, T. and Unruh, J.B. et al., “Survey of Water Use and Management Practices on US Golf Courses from 2005 to 2024,” HortTechnology Vol. 35 No. 5, September 2025 (GCSAA/NGF/USGA peer-reviewed national water survey). 1.63 million acre-feet (approximately 531 billion gallons) applied in 2024. https://journals.ashs.org/view/journals/horttech/35/5/article-p848.xml (archived: https://web.archive.org/web/20261002110552/https://journals.ashs.org/view/journals/horttech/35/5/article-p848.xml) Corroboration: GCSAA news release, “Golf courses reduce water usage by 31 percent, according to national survey,” December 30, 2025 (“1.63 million acre-feet of water in 2024”). https://www.gcsaa.org/who-we-are/media/news-release/2025/12/30/golf-courses-reduce-water-usage-by-31-percent-according-to-national-survey (archived: https://web.archive.org/web/20260904053228/https://www.gcsaa.org/who-we-are/media/news-release/2025/12/30/golf-courses-reduce-water-usage-by-31-percent-according-to-national-survey)
[21] Andy Masley, “Data centers’ heat exhaust is not raising the land temperature around where they’re built,” The Weird Turn Pro (Substack), March 31, 2026. [Commentary, not peer-reviewed.] https://blog.andymasley.com/p/data-centers-heat-exhaust-is-not (archived: https://web.archive.org/web/20261013004907/https://blog.andymasley.com/p/data-centers-heat-exhaust-is-not)
[23] Mike Hammett, “An Open Letter to Data Center Developers: Transparency Prevents Delays,” mikehammett.net, 2026. https://www.mikehammett.net/an-open-letter-to-data-center-developers-transparency-prevents-delays/ (archived: https://web.archive.org/web/20260906121023/https://www.mikehammett.net/an-open-letter-to-data-center-developers-transparency-prevents-delays/)
[23a] Microsoft, “Inside Microsoft’s two-decade push to cut water intensity while scaling for growth,” Official Microsoft Blog, June 24, 2026, self-reported claim of reaching water-positive status globally in 2025, five years ahead of the 2030 target set in 2020. https://blogs.microsoft.com/blog/2026/06/24/inside-microsofts-two-decade-push-to-cut-water-intensity-while-scaling-for-growth/ (archived: https://web.archive.org/web/20261013101827/https://blogs.microsoft.com/blog/2026/06/24/inside-microsofts-two-decade-push-to-cut-water-intensity-while-scaling-for-growth/)
[23b] Business and Human Rights Centre, “Amazon, Google, & Microsoft allegedly operating and expanding water-intensive data centres in some of the world’s driest regions,” reporting a former Amazon water sustainability manager’s on-record objection that water offsetting does not function like carbon offsetting because water replenishment is watershed-specific rather than globally fungible. https://www.business-humanrights.org/en/latest-news/amazon-google-microsoft-allegedly-operating-and-expanding-water-intensive-datacentres-in-some-of-the-worlds-driest-region/ (archived: https://web.archive.org/web/20260915142154/https://www.business-humanrights.org/en/latest-news/amazon-google-microsoft-allegedly-operating-and-expanding-water-intensive-datacentres-in-some-of-the-worlds-driest-region/)
[23c] Amazon, “Water stewardship,” Amazon Sustainability: “75% toward AWS water positive by 2030 in 2025, up from 53% in 2024”; goal to “return more water to communities and the environment than we use in our data center operations.” Self-reported. https://sustainability.aboutamazon.com/natural-resources/water (archived: https://web.archive.org/web/20261024080020/https://sustainability.aboutamazon.com/natural-resources/water). Google figure: Google 2025 Environmental Report, freshwater replenishment table, p. 110: freshwater consumption 7,210 million gallons and water replenished 4,590 million gallons in 2024, 64%; see [9]. [25] Gaston, K.J., Visser, M.E., and Hölker, F., “The biological impacts of artificial light at night: the research challenge,” Philosophical Transactions of the Royal Society B: Biological Sciences, Vol. 370, No. 1667, 20140133, May 2015. https://doi.org/10.1098/rstb.2014.0133 (archived: https://web.archive.org/web/20250906061251/https://royalsocietypublishing.org/doi/10.1098/rstb.2014.0133)
[26] International Agency for Research on Cancer, IARC Monographs on the Evaluation of Carcinogenic Risks to Humans, Volume 98: Painting, Firefighting, and Shiftwork. Lyon: IARC, 2010. Classification of shift work involving circadian disruption as Group 2A (probably carcinogenic to humans). Reaffirmed in Volume 124 (Night Shift Work), 2020. https://publications.iarc.who.int/Book-And-Report-Series/Iarc-Monographs-On-The-Identification-Of-Carcinogenic-Hazards-To-Humans/Night-Shift-Work-2020 (archived: https://web.archive.org/web/20261017154102/https://publications.iarc.who.int/Book-And-Report-Series/Iarc-Monographs-On-The-Identification-Of-Carcinogenic-Hazards-To-Humans/Night-Shift-Work-2020)
[27] American Medical Association Council on Science and Public Health, “Human and Environmental Effects of Light Emitting Diode (LED) Community Lighting,” CSAPH Report 2-A-16, adopted June 2016 (AMA Policy H-135.927). https://www.ama-assn.org/sites/ama-assn.org/files/corp/media-browser/public/about-ama/councils/Council%20Reports/council-on-science-public-health/a16-csaph2.pdf (archived: https://web.archive.org/web/20260909024644/https://www.ama-assn.org/sites/ama-assn.org/files/corp/media-browser/public/about-ama/councils/Council%20Reports/council-on-science-public-health/a16-csaph2.pdf)
[27a] Illuminating Engineering Society, “PS-09-17: IES Board Position on AMA CSAPH Report 2-A-16, Human and Environmental Effects of Light Emitting Diode (LED) Community Lighting.” IES formally disagreed with the AMA’s use of correlated color temperature (CCT) as a proxy for circadian health impact, arguing that quantity of light at the retina and duration of exposure are established, at least equally important inputs. https://ies.org/advocacy/ps-09-17/ (archived: https://web.archive.org/web/20261010004135/https://ies.org/advocacy/ps-09-17/) Readable report of the position: John Wallace, Laser Focus World, “The Illuminating Engineering Society disagrees with AMA policy statement on spectral content of LED outdoor lighting,” August 2, 2017 (IES: CCT “is inadequate for the purpose of evaluating possible health outcomes”; key factors are “the quantity of light at the retina of the eye and the duration of exposure”). https://www.laserfocusworld.com/articles/2017/08/the-illuminating-engineering-society-disagrees-with-ama-policy-statement-on-spectral-content-of-led-outdoor-lighting.html (archived: https://web.archive.org/web/20261025162433/https://www.laserfocusworld.com/articles/2017/08/the-illuminating-engineering-society-disagrees-with-ama-policy-statement-on-spectral-content-of-led-outdoor-lighting.html)
[28] Bozejko, M., Tarski, I., and Malodobra-Mazur, M., “Outdoor artificial light at night and human health: A review of epidemiological studies,” Environmental Research, Vol. 218, Article 115049, 2023. https://doi.org/10.1016/j.envres.2022.115049 (archived: https://web.archive.org/web/20240415131632/https://www.sciencedirect.com/science/article/abs/pii/S0013935122023763)
[28a] Jones, R.R., “Exposure to artificial light at night and risk of cancer: where do we go from here?” British Journal of Cancer, Vol. 124, pp. 1-2, January 2021 (National Cancer Institute, NIH). https://doi.org/10.1038/s41416-020-01231-7 (archived: https://web.archive.org/web/20231009234814/https://www.nature.com/articles/s41416-020-01231-7)
[29] The New York Times / CBS Atlanta / Bloomberg Law, reporting on Meta Stanton Springs campus and Newton/Morgan County groundwater, July 2025 through May 2026. Primary: Eli Tan, The New York Times, “Their Water Taps Ran Dry When Meta Built Next Door,” July 14, 2025 (Beverly and Jeff Morris account; 1,000-foot setback; construction beginning 2018; $5,000 in damages; $25,000 well replacement estimate; Newton County Water and Sewerage Authority executive director Mike Hopkins: Meta’s data center uses about 10% of the county’s total daily water; county on track for a water deficit by 2030 according to a 2024 report; Mansfield Mayor Blair Northen: water rates set to increase 33% over the next two years). Syndicated copy: https://www.sanjuandailystar.com/post/their-water-taps-ran-dry-when-meta-built-next-door (archived: https://web.archive.org/web/20261025155119/https://www.sanjuandailystar.com/post/their-water-taps-ran-dry-when-meta-built-next-door) CBS Atlanta, “AOC presses EPA over Morgan County drinking water concerns as Meta defends Georgia data center operations,” updated May 28, 2026: Meta’s independent groundwater study by a consulting and engineering firm retained in May 2025 “found that our data center operations and construction had no impact on the resident”; property “located in a separate watershed roughly 1.3 miles from portions of the campus” and “more than a mile away from isolated blasting operations”; House Energy and Commerce Oversight and Investigations Subcommittee hearing, May 20, 2026; Region 4 directed to contact Georgia EPD, Morgan County Public Health Department, and UGA Cooperative Extension; Morgan County health department had received resident questions about low pressure and dirty water. https://www.cbsnews.com/atlanta/news/aoc-presses-epa-over-morgan-county-drinking-water-concerns-tied-to-georgia-data-center-development/ (archived: https://web.archive.org/web/20260720211410/https://www.cbsnews.com/atlanta/news/aoc-presses-epa-over-morgan-county-drinking-water-concerns-tied-to-georgia-data-center-development/). CBS Atlanta, May 28, 2026, reports EPA’s follow-up statement that directing Region 4 to gather information “should not be interpreted as a formal federal investigation,” quoting EPA directly: “looking into a matter and gathering facts is not the same as opening a formal investigation.” https://www.cbsnews.com/atlanta/news/aoc-presses-epa-over-morgan-county-drinking-water-concerns-tied-to-georgia-data-center-development/ (archived: https://web.archive.org/web/20260720211410/https://www.cbsnews.com/atlanta/news/aoc-presses-epa-over-morgan-county-drinking-water-concerns-tied-to-georgia-data-center-development/) and Bloomberg Law, May 21, 2026: https://news.bloomberglaw.com/environment-and-energy/epa-to-investigate-meta-data-center-link-to-contaminated-water (archived: https://web.archive.org/web/20260526080640/https://news.bloomberglaw.com/environment-and-energy/epa-to-investigate-meta-data-center-link-to-contaminated-water)
[29a] Ben Sheidler, JDA spokesman, statement to The New York Times, July 2025, as quoted by Moneywise (republished on Yahoo Finance), May 24, 2026: “The Joint Development Authority did not do a well water study before construction”; the Joint Development Authority of Jasper, Morgan, Newton and Walton Counties did not conduct a well-water study before construction began; cause of residents’ water issues described as unknown, timing “could be a coincidence.” https://finance.yahoo.com/sectors/energy/articles/aoc-holds-jar-brown-water-151500899.html (archived: https://web.archive.org/web/20260731213116/https://finance.yahoo.com/sectors/energy/articles/aoc-holds-jar-brown-water-151500899.html)
[29b] Dylan Jackson and Zachary Hansen, The Atlanta Journal-Constitution, “Georgia families sue Meta, accuse its data center of tainting their water,” September 1, 2026: complaint filed in Gwinnett County by four families including Jeff and Beverly Morris against Meta and the Joint Development Authority of Jasper, Morgan, Newton and Walton Counties; allegations that tree clearing, blasting, and excavation disturbed the aquifer and contaminated wells with silt and sediment, plus dust, nighttime light, noise, and air emissions; Meta’s study found groundwater flows away from the plaintiffs’ properties and all facility water comes from a local utility; Meta “will still defend ourselves from baseless lawsuits”; unsigned EPA letter after the hearing stating neither the agency nor the state of Georgia regulates private drinking water wells. Allegations are unadjudicated. https://www.ajc.com/news/2026/09/georgia-families-sue-meta-accuse-its-data-center-of-tainting-their-water/ (archived: https://web.archive.org/web/20261006163828/https://www.ajc.com/news/2026/09/georgia-families-sue-meta-accuse-its-data-center-of-tainting-their-water/)
[29c] Ashlyn Webb, WSB-TV, “4 Georgia families sue Meta, claim data center construction contaminated well water,” October 21, 2026: Meta letter acknowledging “limited blasting” about 1.1 miles from the Morris property and suggesting “well age and maintenance practices”; Georgia Environmental Protection Division maps showing the campus on a recharge area, the category the state considers most vulnerable to groundwater pollution from surface activities. https://www.wsbtv.com/news/local/4-georgia-families-sue-meta-claim-data-center-construction-contaminated-well-water/FVX726UR7FGJTLEAOYTQ4MDZ2Y/ (archived: https://web.archive.org/web/20261025162445/https://www.wsbtv.com/news/local/4-georgia-families-sue-meta-claim-data-center-construction-contaminated-well-water/FVX726UR7FGJTLEAOYTQ4MDZ2Y/) [30] U.S. EPA, NPDES Construction General Permit (CGP), 2022 version, Parts 1.2 and 2.4. Requires Stormwater Pollution Prevention Plans and erosion and sediment controls for construction activity disturbing one or more acres, incorporating effluent limitations set under 40 CFR Part 450 (Construction and Development Point Source Category). Authorizes certain dewatering discharges as allowable non-stormwater discharges under specified conditions. Does not require pre-construction baseline testing of adjacent private residential wells. https://www.epa.gov/system/files/documents/2022-01/2022-cgp-final-permit.pdf (archived: https://web.archive.org/web/20260908214338/https://www.epa.gov/system/files/documents/2022-01/2022-cgp-final-permit.pdf) Georgia program: Georgia Environmental Protection Division, General NPDES Permits GAR100001 (stand-alone construction), GAR100002 (infrastructure), and GAR100003 (common development) for stormwater discharges from construction activities; current permits reissued August 1, 2023 and in effect from August 23, 2024 after a stay. https://epd.georgia.gov/forms-and-permits/watershed-protection-branch-forms-permits/storm-water-forms/npdes-construction (archived: https://web.archive.org/web/20261025162738/https://epd.georgia.gov/forms-and-permits/watershed-protection-branch-forms-permits/storm-water-forms/npdes-construction)
[31] Health Canada / Statistics Canada, “Wind Turbine Noise and Health Study: Summary of Results,” November 2014. 1,238 participating households; 12 developments in Ontario and 6 in Prince Edward Island with “315 and 84 wind turbines respectively.” Self-reported sleep, dizziness, tinnitus, migraines, high blood pressure, and other illnesses showed no association with wind turbine noise levels; “WTN was not observed to be related to hair cortisol concentrations, blood pressure, resting heart rate or measured sleep”; “In all cases, annoyance increased with increasing exposure to WTN levels,”. The summary called its results preliminary pending peer review; the peer-reviewed papers are [31a]. https://www.canada.ca/en/health-canada/services/health-risks-safety/radiation/everyday-things-emit-radiation/wind-turbine-noise/wind-turbine-noise-health-study-summary-results.html (archived: https://web.archive.org/web/20261011053025/https://www.canada.ca/en/health-canada/services/health-risks-safety/radiation/everyday-things-emit-radiation/wind-turbine-noise/wind-turbine-noise-health-study-summary-results.html)
[31a] Michaud, D.S., et al., Health Canada Wind Turbine Noise and Health Study, peer-reviewed results, 2016. “Exposure to wind turbine noise: Perceptual responses and reported health effects,” Journal of the Acoustical Society of America 139(3):1443-1454, DOI 10.1121/1.4942391: “Self-reported health effects (e.g., migraines, tinnitus, dizziness, etc.), sleep disturbance, sleep disorders, quality of life, and perceived stress were not related to WTN levels.” https://pubmed.ncbi.nlm.nih.gov/27036283/ (archived: https://web.archive.org/web/20261011154040/https://pubmed.ncbi.nlm.nih.gov/27036283/). Annoyance paper, JASA 139(3):1455-1466, DOI 10.1121/1.4942390: “for each 5 dB increase in WTN levels, the odds of reporting to be either very or extremely (i.e., highly) annoyed increased by 2.60.” https://pubmed.ncbi.nlm.nih.gov/27036284/ (archived: https://web.archive.org/web/20261014135119/https://pubmed.ncbi.nlm.nih.gov/27036284/). Stress biomarkers paper, JASA 139(3):1467-1479, DOI 10.1121/1.4942402: WTN exposure had no apparent influence on hair cortisol, resting blood pressure, or heart rate. https://pubmed.ncbi.nlm.nih.gov/27036285/ (archived: https://web.archive.org/web/20250205133304/https://pubmed.ncbi.nlm.nih.gov/27036285/). Sleep paper, Sleep 39(1):97-109, DOI 10.5665/sleep.5326: “Self-reported and objectively measured sleep outcomes consistently revealed no apparent pattern or statistically significant relationship to WTN levels.” https://pubmed.ncbi.nlm.nih.gov/26518593/ (archived: https://web.archive.org/web/20260430093401/https://pubmed.ncbi.nlm.nih.gov/26518593/)
[32] National Institute for Occupational Safety and Health (NIOSH), Health Hazard Evaluation Report No. 2019-0119-3362, “Evaluation of Low Frequency Noise, Infrasound, and Health Symptoms at an Administrative Building and Men’s Shelter,” October 2019. Citing Johnson (1982): the review “did not find evidence of hearing threshold shifts from continuous exposures to levels of 118 dB or less for 24 hours”; “The frequency-specific or overall sound levels we measured are not known to cause adverse health effects.” https://www.cdc.gov/niosh/hhe/reports/pdfs/2019-0119-3362.pdf (archived: https://web.archive.org/web/20260909192039/https://www.cdc.gov/niosh/hhe/reports/pdfs/2019-0119-3362.pdf)
[32a] Leventhall, G., “Low Frequency Noise. What we know, what we do not know, and what we would like to know,” Journal of Low Frequency Noise, Vibration and Active Control, Vol. 28, No. 2, pp. 79-104, 2009. Median hearing threshold about 97 dB at 10 Hz and about 107 dB at 4 Hz (Table I, p. 80); quoting Berglund and Lindvall, “There is no reliable evidence that infrasounds below the hearing threshold produce physiological or psychological effects” (p. 92). Reprint: https://scispace.com/pdf/low-frequency-noise-what-we-know-what-we-do-not-know-and-zeeq9a7cmr.pdf (archived: https://web.archive.org/web/20250520182235/https://scispace.com/pdf/low-frequency-noise-what-we-know-what-we-do-not-know-and-zeeq9a7cmr.pdf)
[33] Stratford Analytics, “Data Center Jobs: Economic Impact vs. Energy Costs Explained,” 2026; Congressional Research Service, “Data Centers and Their Energy Consumption: Frequently Asked Questions,” R48646, May 2026. Utility-scale data centers (100-500 MW IT load) typically employ 50 to 200 full-time operations workers; hyperscale facilities are defined by industry analysts as exceeding 100 MW electric power rating; new hyperscale facilities have been built with capacities from 100 MW to 1,000 MW. https://www.stratfordanalytics.com/data-center-economic-impact-energy-costs-vs-job-creation/ (archived: https://web.archive.org/web/20261025155511/https://www.stratfordanalytics.com/data-center-economic-impact-energy-costs-vs-job-creation/) and https://www.congress.gov/crs-product/R48646 (archived: https://web.archive.org/web/20261016235109/https://www.congress.gov/crs-product/R48646)
[33a] LOCUS (locusdata.io), “Impacts of warehouses and ports on truck traffic,” analysis of Arizona truck traffic data documenting disproportionate nighttime truck activity around logistics facilities. [Data-vendor blog, not peer reviewed.] https://locusdata.io/blog/impacts-of-warehouses-and-ports-on-truck-traffic (archived: https://web.archive.org/web/20260416171405/https://locusdata.io/blog/impacts-of-warehouses-and-ports-on-truck-traffic)
[34] International Commission on Non-Ionizing Radiation Protection, “Guidelines for Limiting Exposure to Time-Varying Electric and Magnetic Fields (1 Hz to 100 kHz),” Health Physics, Vol. 99, No. 6, pp. 818-836, 2010. This is the current ICNIRP primary guideline for extremely low frequency fields, superseding the 1998 up-to-300-GHz guideline for this frequency range. Reference levels at 50/60 Hz: 200 microtesla (2,000 milligauss) general public, 1 millitesla (10,000 milligauss) occupational. Read directly: Table 4 general public reference level 2 x 10^-4 T and Table 3 occupational 1 x 10^-3 T at 50 to 400 Hz; “It is the view of ICNIRP that the currently existing scientific evidence that prolonged exposure to low frequency magnetic fields is causally related with an increased risk of childhood leukemia is too weak to form the basis for exposure guidelines”; pooled analyses “indicate that an excess risk may exist for average exposures exceeding 0.3-0.4 µT”; the only well-established effects in volunteers are nerve stimulation and retinal phosphenes. https://www.icnirp.org/cms/upload/publications/ICNIRPLFgdl.pdf (archived: https://web.archive.org/web/20261012204141/https://www.icnirp.org/cms/upload/publications/ICNIRPLFgdl.pdf). Milligauss figures are direct conversions of ICNIRP’s 200 µT and 1 mT (1 µT = 10 mG).
[35] International Agency for Research on Cancer, IARC Monographs on the Evaluation of Carcinogenic Risks to Humans, Volume 80, “Non-Ionizing Radiation, Part 1: Static and Extremely Low-Frequency (ELF) Electric and Magnetic Fields,” 2002: ELF magnetic fields classified Group 2B, possibly carcinogenic to humans, on the basis of childhood leukaemia epidemiology, as described in ICNIRP 2010 [34] and WHO Fact Sheet 322 [35a]. https://publications.iarc.who.int/Book-And-Report-Series/Iarc-Monographs-On-The-Identification-Of-Carcinogenic-Hazards-To-Humans/Non-ionizing-Radiation-Part-1-Static-And-Extremely-Low-frequency-ELF-Electric-And-Magnetic-Fields-2002 (archived: https://web.archive.org/web/20260924134857/https://publications.iarc.who.int/Book-And-Report-Series/Iarc-Monographs-On-The-Identification-Of-Carcinogenic-Hazards-To-Humans/Non-ionizing-Radiation-Part-1-Static-And-Extremely-Low-frequency-ELF-Electric-And-Magnetic-Fields-2002)
[35a] World Health Organization, “Electromagnetic fields and public health: Exposure to extremely low frequency fields,” Fact Sheet No. 322, June 2007. IARC classification based on “pooled analyses of epidemiological studies demonstrating a consistent pattern of a two-fold increase in childhood leukaemia associated with average exposure to residential power-frequency magnetic field above 0.3 to 0.4 µT” (3 to 4 milligauss); “the evidence related to childhood leukaemia is not strong enough to be considered causal.” Copy hosted by the Bonneville Power Administration: https://www.bpa.gov/-/media/Aep/lands/EMF_WHO_EMF-Fact-Sheet-2007a1.pdf (archived: https://web.archive.org/web/20261025155101/https://www.bpa.gov/-/media/Aep/lands/EMF_WHO_EMF-Fact-Sheet-2007a1.pdf)
[36] Netherlands National Institute for Public Health and the Environment (RIVM), “Comparison of international policies on electromagnetic fields (power frequency and radiofrequency fields),” 2018, p. 8: “United States: No federal legislation is in force. In some states (Colorado, Connecticut, Hawaii, Maryland, Ohio), variations on the ‘prudent avoidance’ principle have been adopted. … In other states, fixed limits for the electric or magnetic field of power lines are set, varying from 20% to 240% of the reference level in the EU recommendation (Florida, Minnesota, Montana, New Jersey, New York, Oregon).” Illinois appears in neither list. https://www.rivm.nl/sites/default/files/2018-11/Comparison%20of%20international%20policies%20on%20electromagnetic%20fields%202018.pdf (archived: https://web.archive.org/web/20261025155410/https://www.rivm.nl/sites/default/files/2018-11/Comparison%20of%20international%20policies%20on%20electromagnetic%20fields%202018.pdf)
[36a] City of Chandler, Arizona, Ordinance No. 5033, Zoning Code amendment PLH22-0053 adding Chapter 35, Section 35-2214 (Data Centers), and Council Memo dated December 8, 2022 (Planning and Zoning Commission October 19, 2022, 7-0; introduced and tentatively adopted December 5, 2022). Memo: potential impacts “primarily from unwanted noise”; “As these data centers have developed closer to the urbanized area of Chandler, including residential areas, the potential for noise compatibility issues has increased”; “an industry migration from water-cooled to electrically-cooled facilities”; the lack of rules “has caused confusion for both the data center industry and Chandler residents.” Ordinance 35-2214(3) to (7): on-site liaison for noise complaints; pre-construction “sound study performed by a third-party acoustic engineer” at “the property line of the nearest property”; mitigation to prevent noise “from exceeding the ambient noise levels that were observed in the baseline study”; post-construction study “during peak operation of the Data Center mechanical equipment” and annual studies for five years; generator testing announced 24 hours in advance and limited to 9:00 a.m. to 5:00 p.m., Monday through Friday. No decibel limit. https://www.chandleraz.gov/sites/default/files/departments/development-services/PLH22-0053-Ordinance-No-5033-Data-Center.pdf (archived: https://web.archive.org/web/20261012204157/https://www.chandleraz.gov/sites/default/files/departments/development-services/PLH22-0053-Ordinance-No-5033-Data-Center.pdf) and https://www.chandleraz.gov/sites/default/files/departments/development-services/PLH22-0053-Council-Memo.pdf (archived: https://web.archive.org/web/20261010000250/https://www.chandleraz.gov/sites/default/files/departments/development-services/PLH22-0053-Council-Memo.pdf). City release, “Chandler’s data center ordinance now in effect,” January 11, 2023 (effective January 5, 2023): https://www.chandleraz.gov/news-center/chandlers-data-center-ordinance-now-effect (archived: https://web.archive.org/web/20261010004135/https://www.chandleraz.gov/news-center/chandlers-data-center-ordinance-now-effect)
[36b] ABC15 Arizona, “Loud hum consuming Chandler neighborhood,” February 26, 2019. Residents near Dobson and Queen Creek roads; noise attributed to 24 chillers at a CyrusOne data center; CyrusOne statement that it continues to comply with Chandler’s ordinances; council discussion of enforcing the noise ordinance. https://www.abc15.com/news/region-southeast-valley/chandler/loud-hum-consuming-chandler-neighborhood (archived: https://web.archive.org/web/20260218122654/https://www.abc15.com/news/region-southeast-valley/chandler/loud-hum-consuming-chandler-neighborhood) [37] Planet Detroit, “Saline residents blast Oracle data center construction,” March 17, 2026, and FOX 2 Detroit, “Saline Twp. data center construction causing noise complaints, Oracle responds.” Resident complaints of speeding gravel haulers, noise, dust, and road damage; Saline Mayor Brian Marl met with contractor Walbridge and pledged additional traffic enforcement. https://planetdetroit.org/2026/03/saline-data-center-traffic/ (archived: https://web.archive.org/web/20261024150438/https://planetdetroit.org/2026/03/saline-data-center-traffic/)
[38] Wisconsin Public Radio, “Microsoft sued over noise complaints at new Mount Pleasant data center facility,” July 2, 2026. Residents near the operating facility and the phase-three construction site reported construction noise, dust, light pollution, and truck traffic. https://www.wpr.org/news/microsoft-sued-noise-complaints-at-new-mount-pleasant-data-center (archived: https://web.archive.org/web/20261016202631/https://www.wpr.org/news/microsoft-sued-noise-complaints-at-new-mount-pleasant-data-center)
[39] CBS 21 / local21news, “What’s it like living next to a data center construction site? Residents weigh in,” Middlesex Township, Cumberland County, Pennsylvania, April 28, 2026. Township-reported construction hours of 6 a.m. to 6 p.m.; contractors conducted pre-blast inspections documenting existing conditions in nearby homes and installed seismographs to measure ground movement. https://local21news.com/news/local/whats-it-like-living-next-to-a-data-center-construction-site-middlesex-township-acres-township-officials-country-club-road (archived: https://web.archive.org/web/20260820125637/https://local21news.com/news/local/whats-it-like-living-next-to-a-data-center-construction-site-middlesex-township-acres-township-officials-country-club-road)
[40] Virginia Mercury, “Brown water, dust and loud noises: Louisa homeowner sues Amazon over data center construction,” July 28, 2026. Allegations are unadjudicated. https://virginiamercury.com/2026/07/28/brown-water-dust-and-loud-noises-louisa-homeowner-sues-amazon-over-data-center-construction/ (archived: https://web.archive.org/web/20260730185048/https://virginiamercury.com/2026/07/28/brown-water-dust-and-loud-noises-louisa-homeowner-sues-amazon-over-data-center-construction/)
[41] Fox Carolina, “Spartanburg residents say data center construction is already disrupting their lives,” July 23, 2026. Residents reported dust and said clearing of several acres of trees removed a sound buffer. https://www.foxcarolina.com/2026/07/23/spartanburg-residents-say-data-center-construction-is-already-disrupting-their-lives/ (archived: https://web.archive.org/web/20260902163554/https://www.foxcarolina.com/2026/07/23/spartanburg-residents-say-data-center-construction-is-already-disrupting-their-lives/)
[41a] 35 Ill. Adm. Code 901.102, Sound Emitted to Class A Land (Illinois Pollution Control Board noise regulations, Part 901, with Part 900 definitions and measurement procedures). Allowable octave-band sound pressure levels from Class B land (commercial and service uses) to Class A land (residential), nighttime: 63 dB at 31.5 Hz, 61 at 63 Hz, 55 at 125 Hz, 47 at 250 Hz, 40 at 500 Hz, 35 at 1,000 Hz, 30 at 2,000 Hz, 25 at 4,000 and 8,000 Hz; daytime: 72, 71, 65, 57, 51, 45, 39, 34, 32; Class C (manufacturing and industrial) sources have higher limits; measurements “at least 25 feet from the property-line noise source” at any point within the receiving Class A land. https://ilga.gov/ftp/JCAR/AdminCode/035/035009010001020R.html (archived: https://web.archive.org/web/20261025154950/https://ilga.gov/ftp/JCAR/AdminCode/035/035009010001020R.html)
[42] 55 ILCS 5/5-12020, Counties Code, commercial wind energy facilities and commercial solar energy facilities: county siting standards including a deconstruction (decommissioning) plan and financial assurance, implemented through the Agricultural Impact Mitigation Agreement with the Illinois Department of Agriculture. Accessible county implementation: Macon County Code, Chapter 156, Commercial Solar Energy Facility Siting: applicant “must submit a decommissioning plan with cost estimation to the county as part of the siting application” and “post the required financial assurances for the benefit of the county” before a building permit; “The decommissioning agreement and financial assurances shall comply with 55 ILCS 5/5-12020.” https://codelibrary.amlegal.com/codes/maconcounty/latest/maconcounty_il/0-0-0-8916 (archived: https://archive.org/details/macon-county-code-chapter-156-2026-10-25, the page text as displayed October 25, 2026, uploaded because the Wayback Machine cannot capture the code library’s JavaScript page)
[43] Illinois Freedom of Information Act, 5 ILCS 140/7(1)(g), exemption for trade secrets and commercial or financial information furnished under a claim that they are proprietary, privileged, or confidential, where disclosure would cause competitive harm. Summary of the showing required and the public body’s burden: Hinshaw & Culbertson LLP, “Informing Illinois Newsletter,” January 2017: “the burden of proving the propriety of the exemption lies with the public body.” https://www.hinshawlaw.com/en/insights/hinshaw-alert/informing-illinois-newsletter-january-2017 (archived: https://web.archive.org/web/20261025155209/https://www.hinshawlaw.com/en/insights/hinshaw-alert/informing-illinois-newsletter-january-2017) [Law-firm summary; statute text at ilga.gov, 5 ILCS 140/7.]
[44] 20 ILCS 605/605-1025, Data center investment (Illinois Data Center Investment Program). “Qualifying Illinois data center”: capital investment “of at least $250,000,000 over a 60-month period beginning on or after January 1, 2020” and “the creation of at least 20 full-time or full-time equivalent new jobs over a period of 60 months” with compensation “equal to or greater than 120% of the average wage paid to full-time employees” in the county; certification “within 2 years after being placed in service” that the data center “is carbon neutral or has attained certification under one or more of the following green building standards”: BREEAM, ENERGY STAR, Envision, ISO 50001, LEED, Green Globes, UL 3223, “or an equivalent program approved by the Department of Commerce and Economic Opportunity.” https://www.ilga.gov/Documents/legislation/ilcs/documents/002006050K605-1025.htm (archived: https://web.archive.org/web/20261025152102/https://www.ilga.gov/Documents/legislation/ilcs/documents/002006050K605-1025.htm) Issuing agency: Illinois Department of Commerce and Economic Opportunity, “Data Center Investment Program 2025 Annual Report” (activity through December 31, 2025): “Within two years of the project being placed in service, demonstrate that the data center is carbon neutral” or “attained one of the following green building standards”; 34 approved applications. https://dceo.illinois.gov/content/dam/soi/en/web/dceo/aboutdceo/reportsrequiredbystatute/2025-data-centers-annual-report.pdf (archived: https://web.archive.org/web/20261012140227/https://dceo.illinois.gov/content/dam/soi/en/web/dceo/aboutdceo/reportsrequiredbystatute/2025-data-centers-annual-report.pdf)
[45] Maggie Dougherty, Capitol News Illinois, “Gov. JB Pritzker suspends tax breaks for data centers, urging more discussion,” June 5, 2026. Pause on new data center tax incentive agreements effective July 1, 2026, citing “growing impacts on energy affordability and water resources”; 27 data centers received more than $983 million in incentives from 2020 to 2024 per a state report; POWER Act (HB 5513) failed by the May 31 deadline; governor’s call for a “comprehensive framework” in the fall veto session. https://capitolnewsillinois.com/news/gov-jb-pritzker-to-suspend-tax-breaks-for-data-centers-urging-more-discussion/ (archived: https://web.archive.org/web/20261002090321/https://capitolnewsillinois.com/news/gov-jb-pritzker-to-suspend-tax-breaks-for-data-centers-urging-more-discussion/)